Calculation of solar irradiation at arbitrary spatial location and time is based on formulas found in websites [1, 2] and paper [6].
Direct component of solar irradiation depends on air mass and height above sea level.
The air mass coefficient defines the direct optical path length through the Earth's atmosphere,
expressed as a ratio relative to the path length vertically upwards, i.e. at the zenith.
It has the lowest value if the zenith angle of the sun is zero.
If the zenith angle increases, solar rays have to travel larger distances through the earth atmosphere and the air mass coefficient increases.
Simple angular formula works for the zenith angle up to 75 degrees. A good approximation exists for larger zenith angles, see [1, 2, 6].
Higher height above sea level reduces the length of the atmosphere that sun rays need to travel.
An approximation of solar irradiation on height above sea level is given in [6] that works up to altitude of 2 km.
Since the maximal height in teritory of Latvia is just over 300 m above sea level, the effect from elevation is negligible.
Even on a clear day, the diffuse radiation is still about 10% of the direct component.
It is hard to estimate the actual diffuse radiation as it depends much on atmospheric conditions, zenith angle and clouds.
Websites [1, 2] suggest that on a clear day the global irradiance on a module perpendicular to the sun's rays should be multiplied by 1.1.
Better formulation is used in [6] that includes dependence on the zenith angle of the Sun. So, we use the approach in [6] to estimate the diffuse radiation.
Diffuse radiation plays considerable role when sun is close to horizont when direct beam irradiance becomes less important.
Earth is not a constant distant from the Sun but is a bit closer to the Sun in winter.
This factor is taken into account by adjusting extraterrestial irradiation [6].
The most tricky part in calculating of solar irradiation is calculation of zenith angle at arbitrary date-time and location.
The elevation angle is similar to the zenith angle but it is measured from the horizinatal rather than from the vertical,
thus making the zenith angle = 90° - elevation. The elevation can be found using the solar declination angle, latitude, and hour angle [1,2].
Solar declination is angle between earth equatorial plane and plane containing actual solar orbit. It varies from -23.45 degrees to 23.45 degrees.
The Hour Angle converts the local solar time (LST) into the number of degrees which the sun moves across the sky.
By definition, the Hour Angle is 0° at solar noon.
Since the Earth rotates 15° per hour, each hour away from solar noon corresponds to an angular motion of the sun in the sky of 15°.
In the morning the hour angle is negative, in the afternoon the hour angle is positive.
The equation for local solar time includes local time, longitude, and the correction for the eccentricity of the Earth's orbit and the Earth's axial tilt [1, 2].
The above mentioned calculation of solar radiation is valid for clear skies.
Presence of clouds reduce the solar irradiation.
Several approximations exist to account cloud cover factor in solar irradiation.
Unfortunately, historical observations include subjective estimation of cloud factor expressed in grades in range from 1 (clear skies) to 10 (fully cloudy).
We transform this quantity C to be on range 0 (clear skies) to 1 (fully cloudy).
Empirical data suggest that formula in [5] works well, that is solar irradiation should be multiplied by (1-0.75*C^3), if we consider radiation on a horizontal plane.
Solar irradiation depends on the orientation of photovoltaic device.
It is best to orientate the plane normal to the sun rays. However, then it needs to follow the Sun.
For simplicity let us asssume that we are interested on absorption in horizontal plane.
Then we need to multilpy the solar irradiation with cosine of the zenith angle and refracted solar radiation from the erth surface can be disregarded.
Solar irradiation in RCM
Regional climate models contain 8 components related to solar irradiation:
Net SW surface radiation
Downward SW surface radiation
Net LW surface radiation
Downward LW surface radiation
Top net SW
Top downward SW radiation
Top net LW
Sunshine duration
As can be seen, Short Wave (SW) and Long Wave (LW) radiations are separated.
Visible light and ultraviolet radiation are commonly called shortwave radiation,
while infrared radiation is referred to as longwave radiation.
The Sun radiates energy mainly in the form of visible light, with small amounts of ultraviolet and infrared radiation [3].
For this reason, solar radiation is usually considered shortwave radiation.
However, earth surface and clouds are much cooler and they are responsible for LW radiation.
There is no distinct treshold between the SW and LW radiation.
There are several types of clouds and they behave differently with respect to SW and LW radiation [4].
Net radiation means difference between incoming downward radiation and upward radiation by the earth.
If we are more interested in photovoltaic applications then downward SW radiation is most important parameter to consider.
The downward SW radiation can vary climatologically due to changes in cloud cover.
Therefore, climatological trends of this parameter is related with climatological trends of total cloud cover.
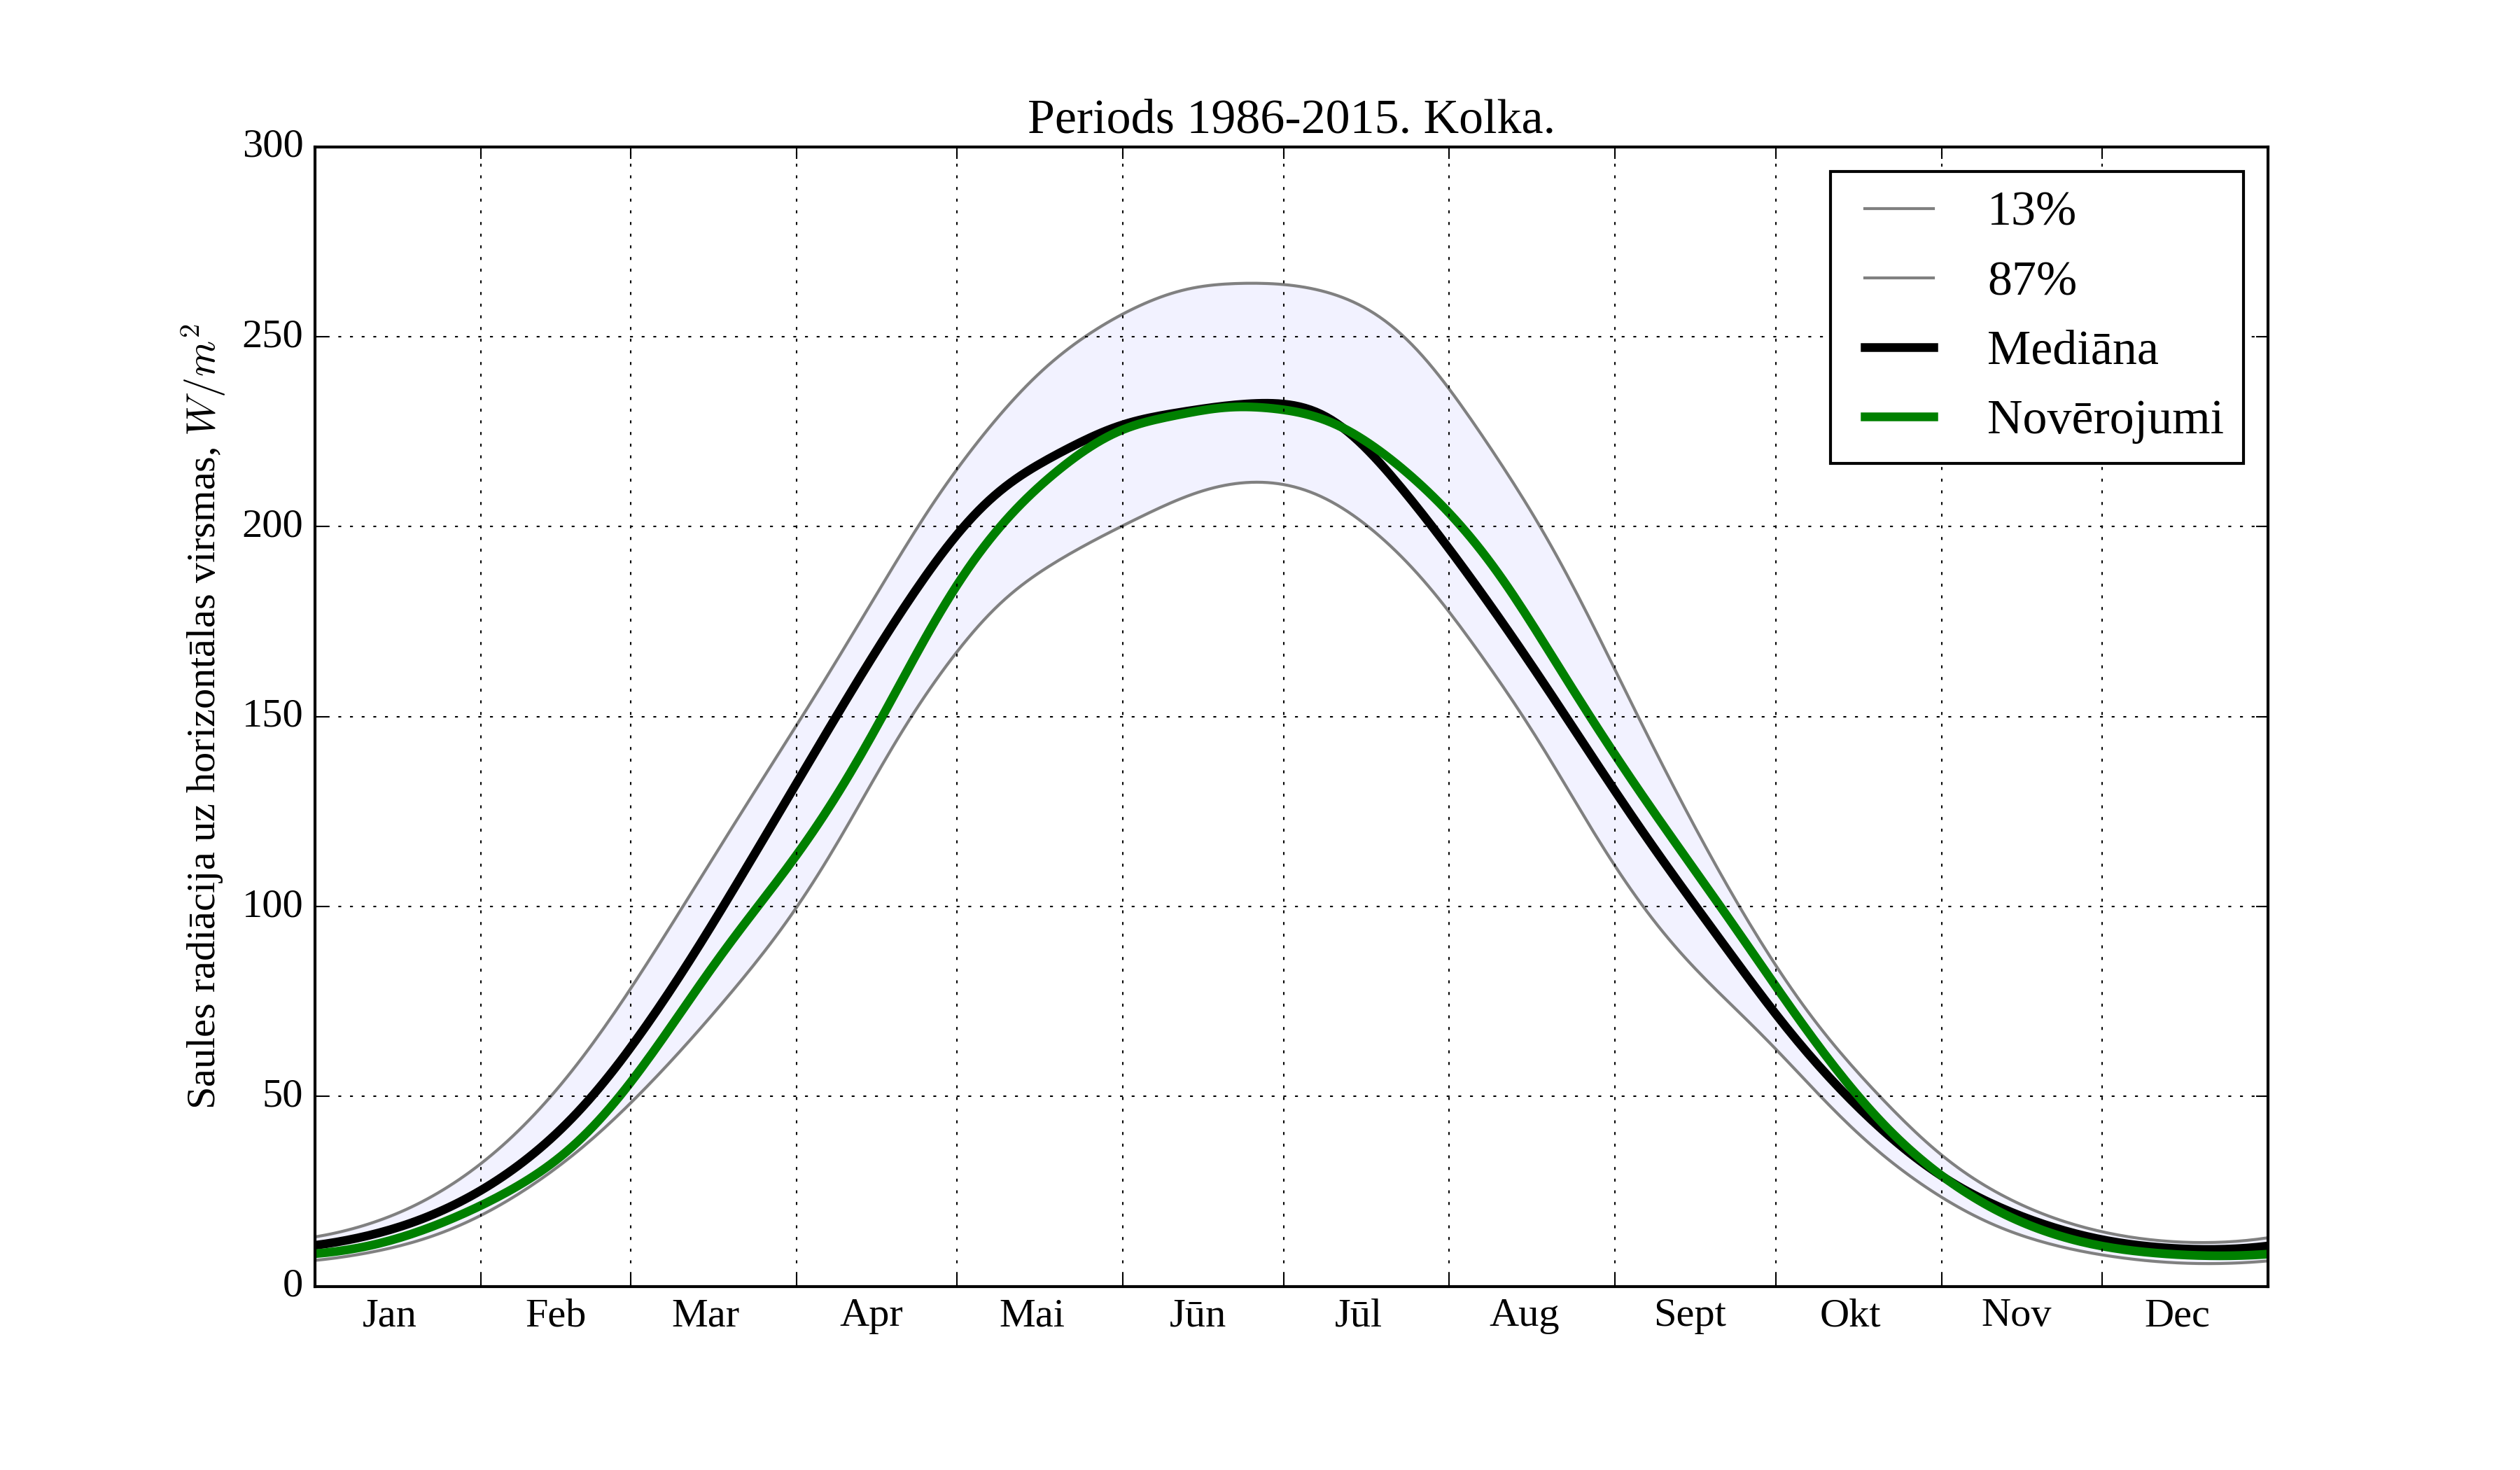
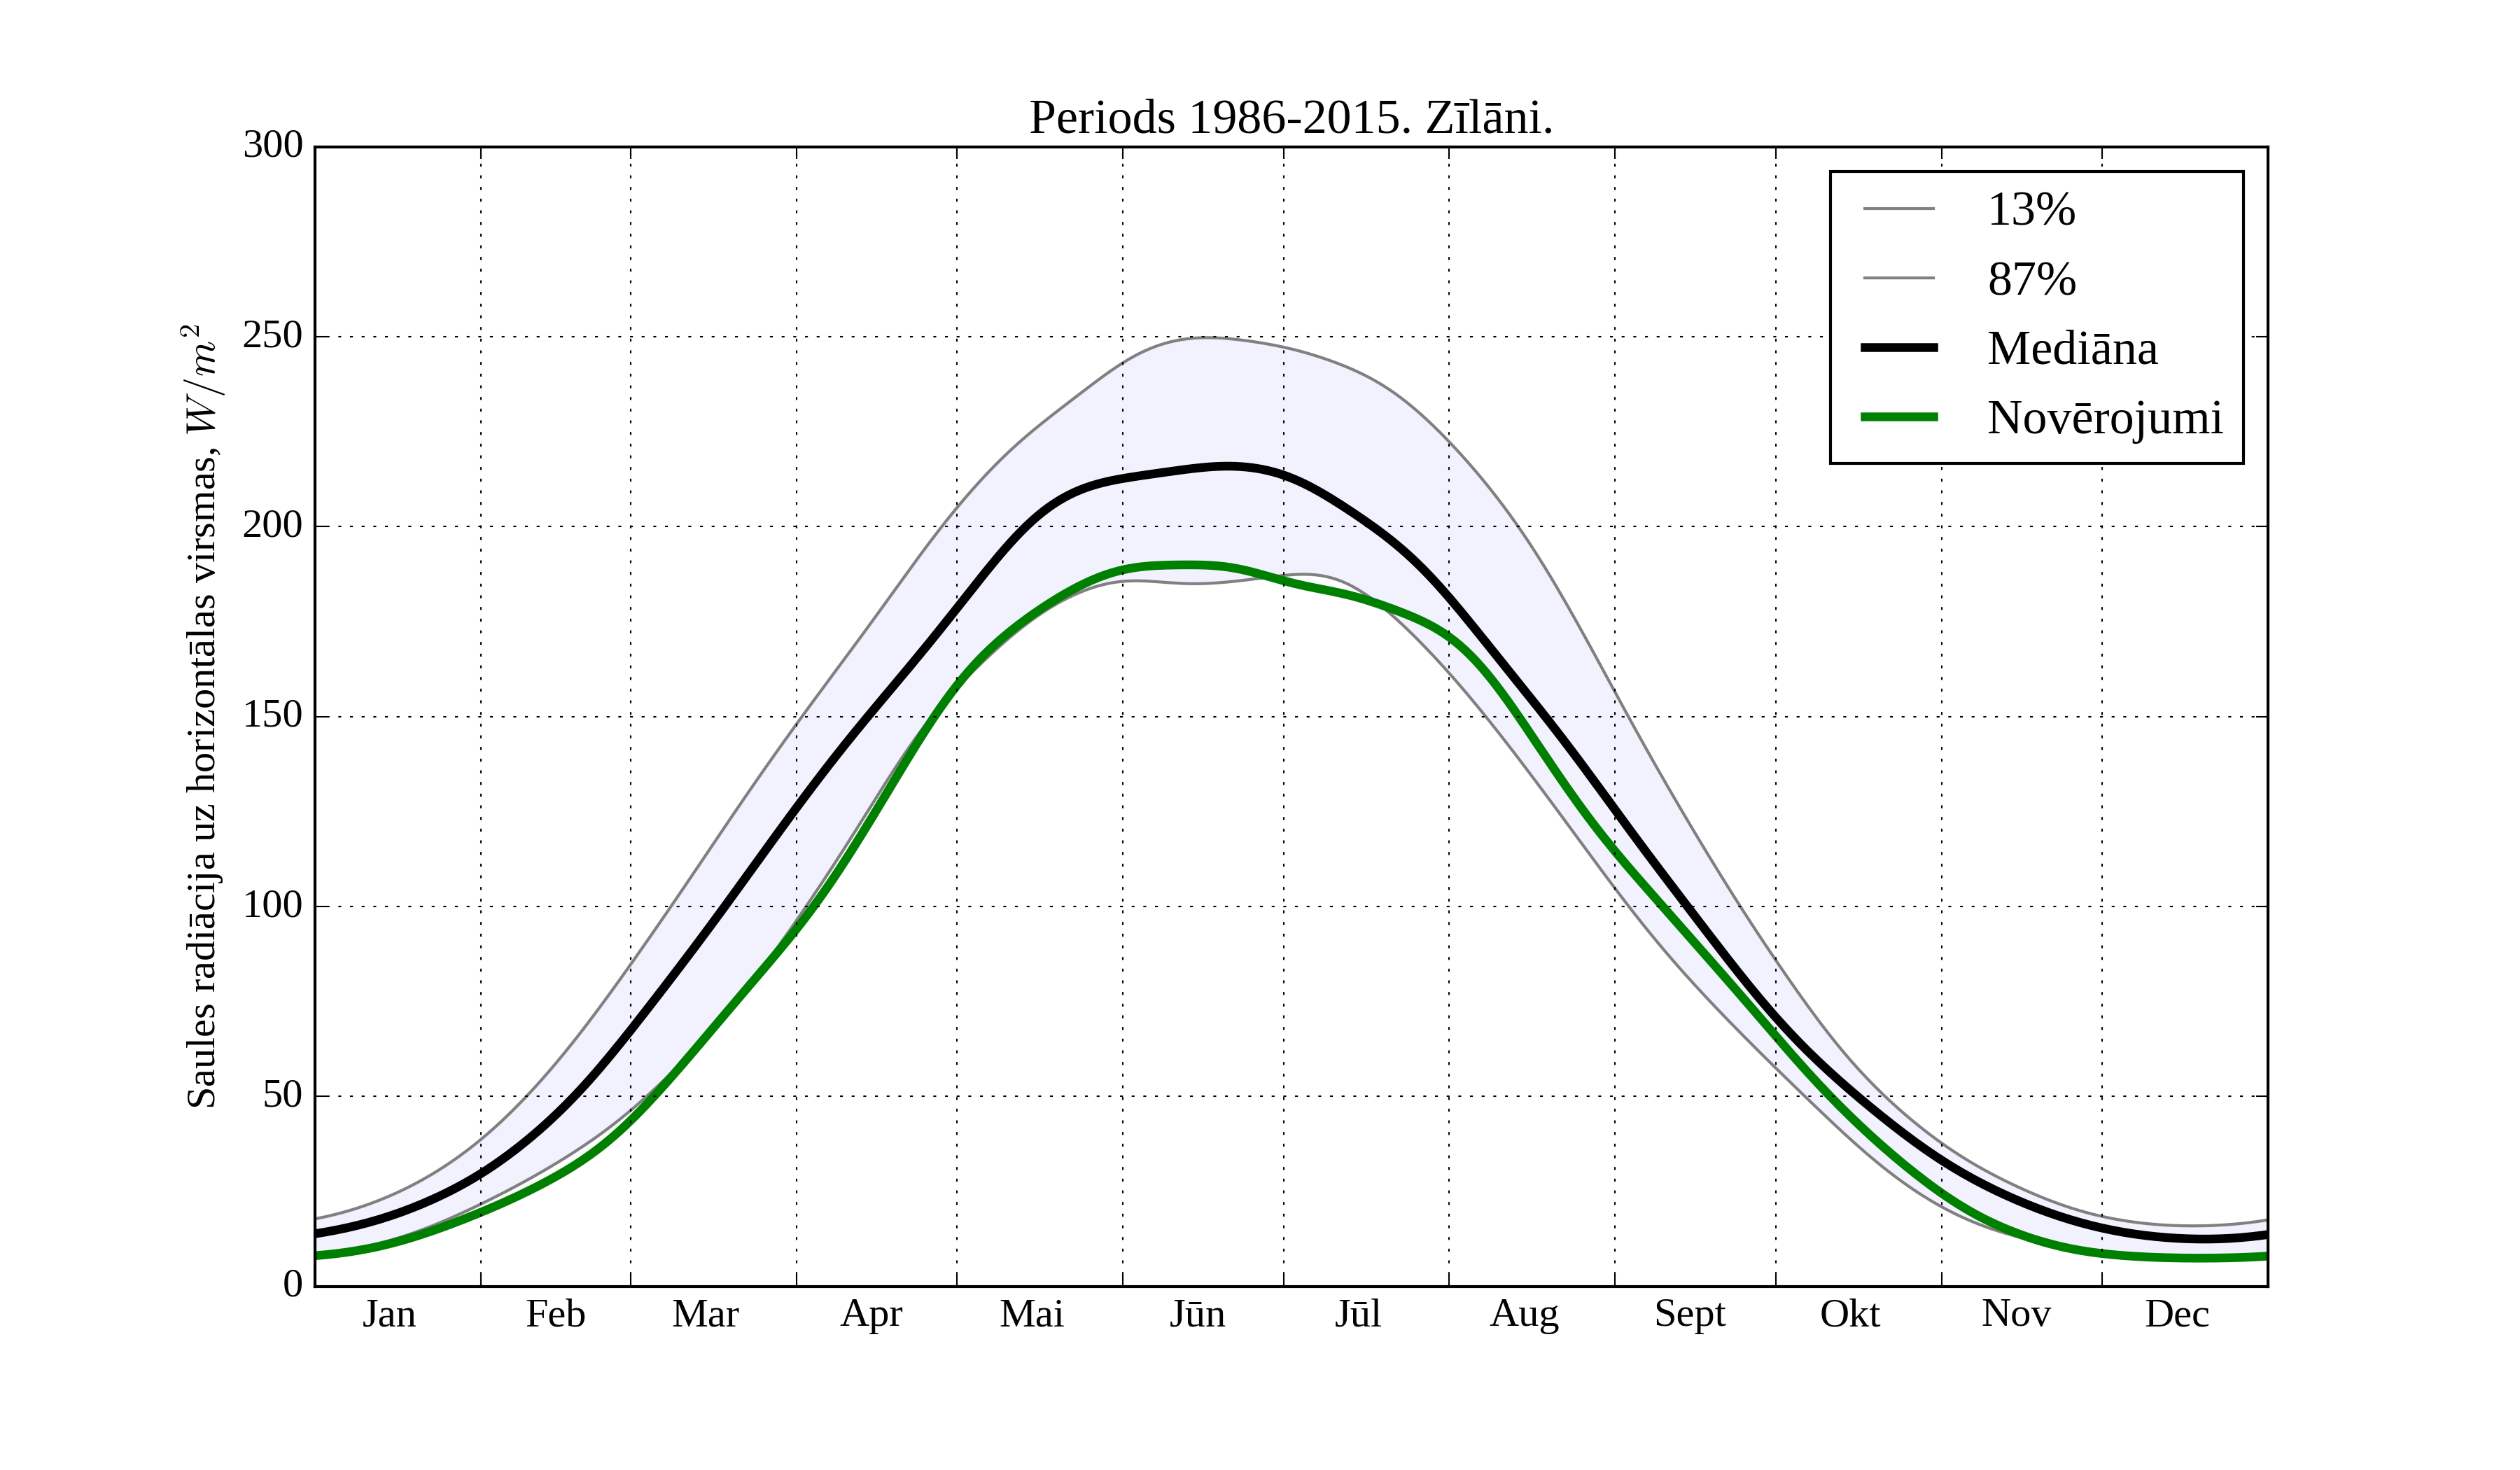
Monthly distributions of downward SW radiation are shown in Figures 1-2 in two stations.
Figure 1. Monthly distribution of downard solar radiation on horizontal surface in Kolka 1986-2015
Figure 2. Monthly distribution of downard solar radiation on horizontal surface in Zilani 1986-2015
Observed radiation is estimated using subjective cloud cover and using the calculations in section 1.
Since the observations of cloud cover are subjective, then derived observations of radiation varies from station to station.
Nevertheless, all the stations have typically the same yearly distribution of downward solar radiation.
Higher solar radiation intensity in winter can be associated with proportionaly higher role of scattered light, that is not included in formulas of the Section 1.
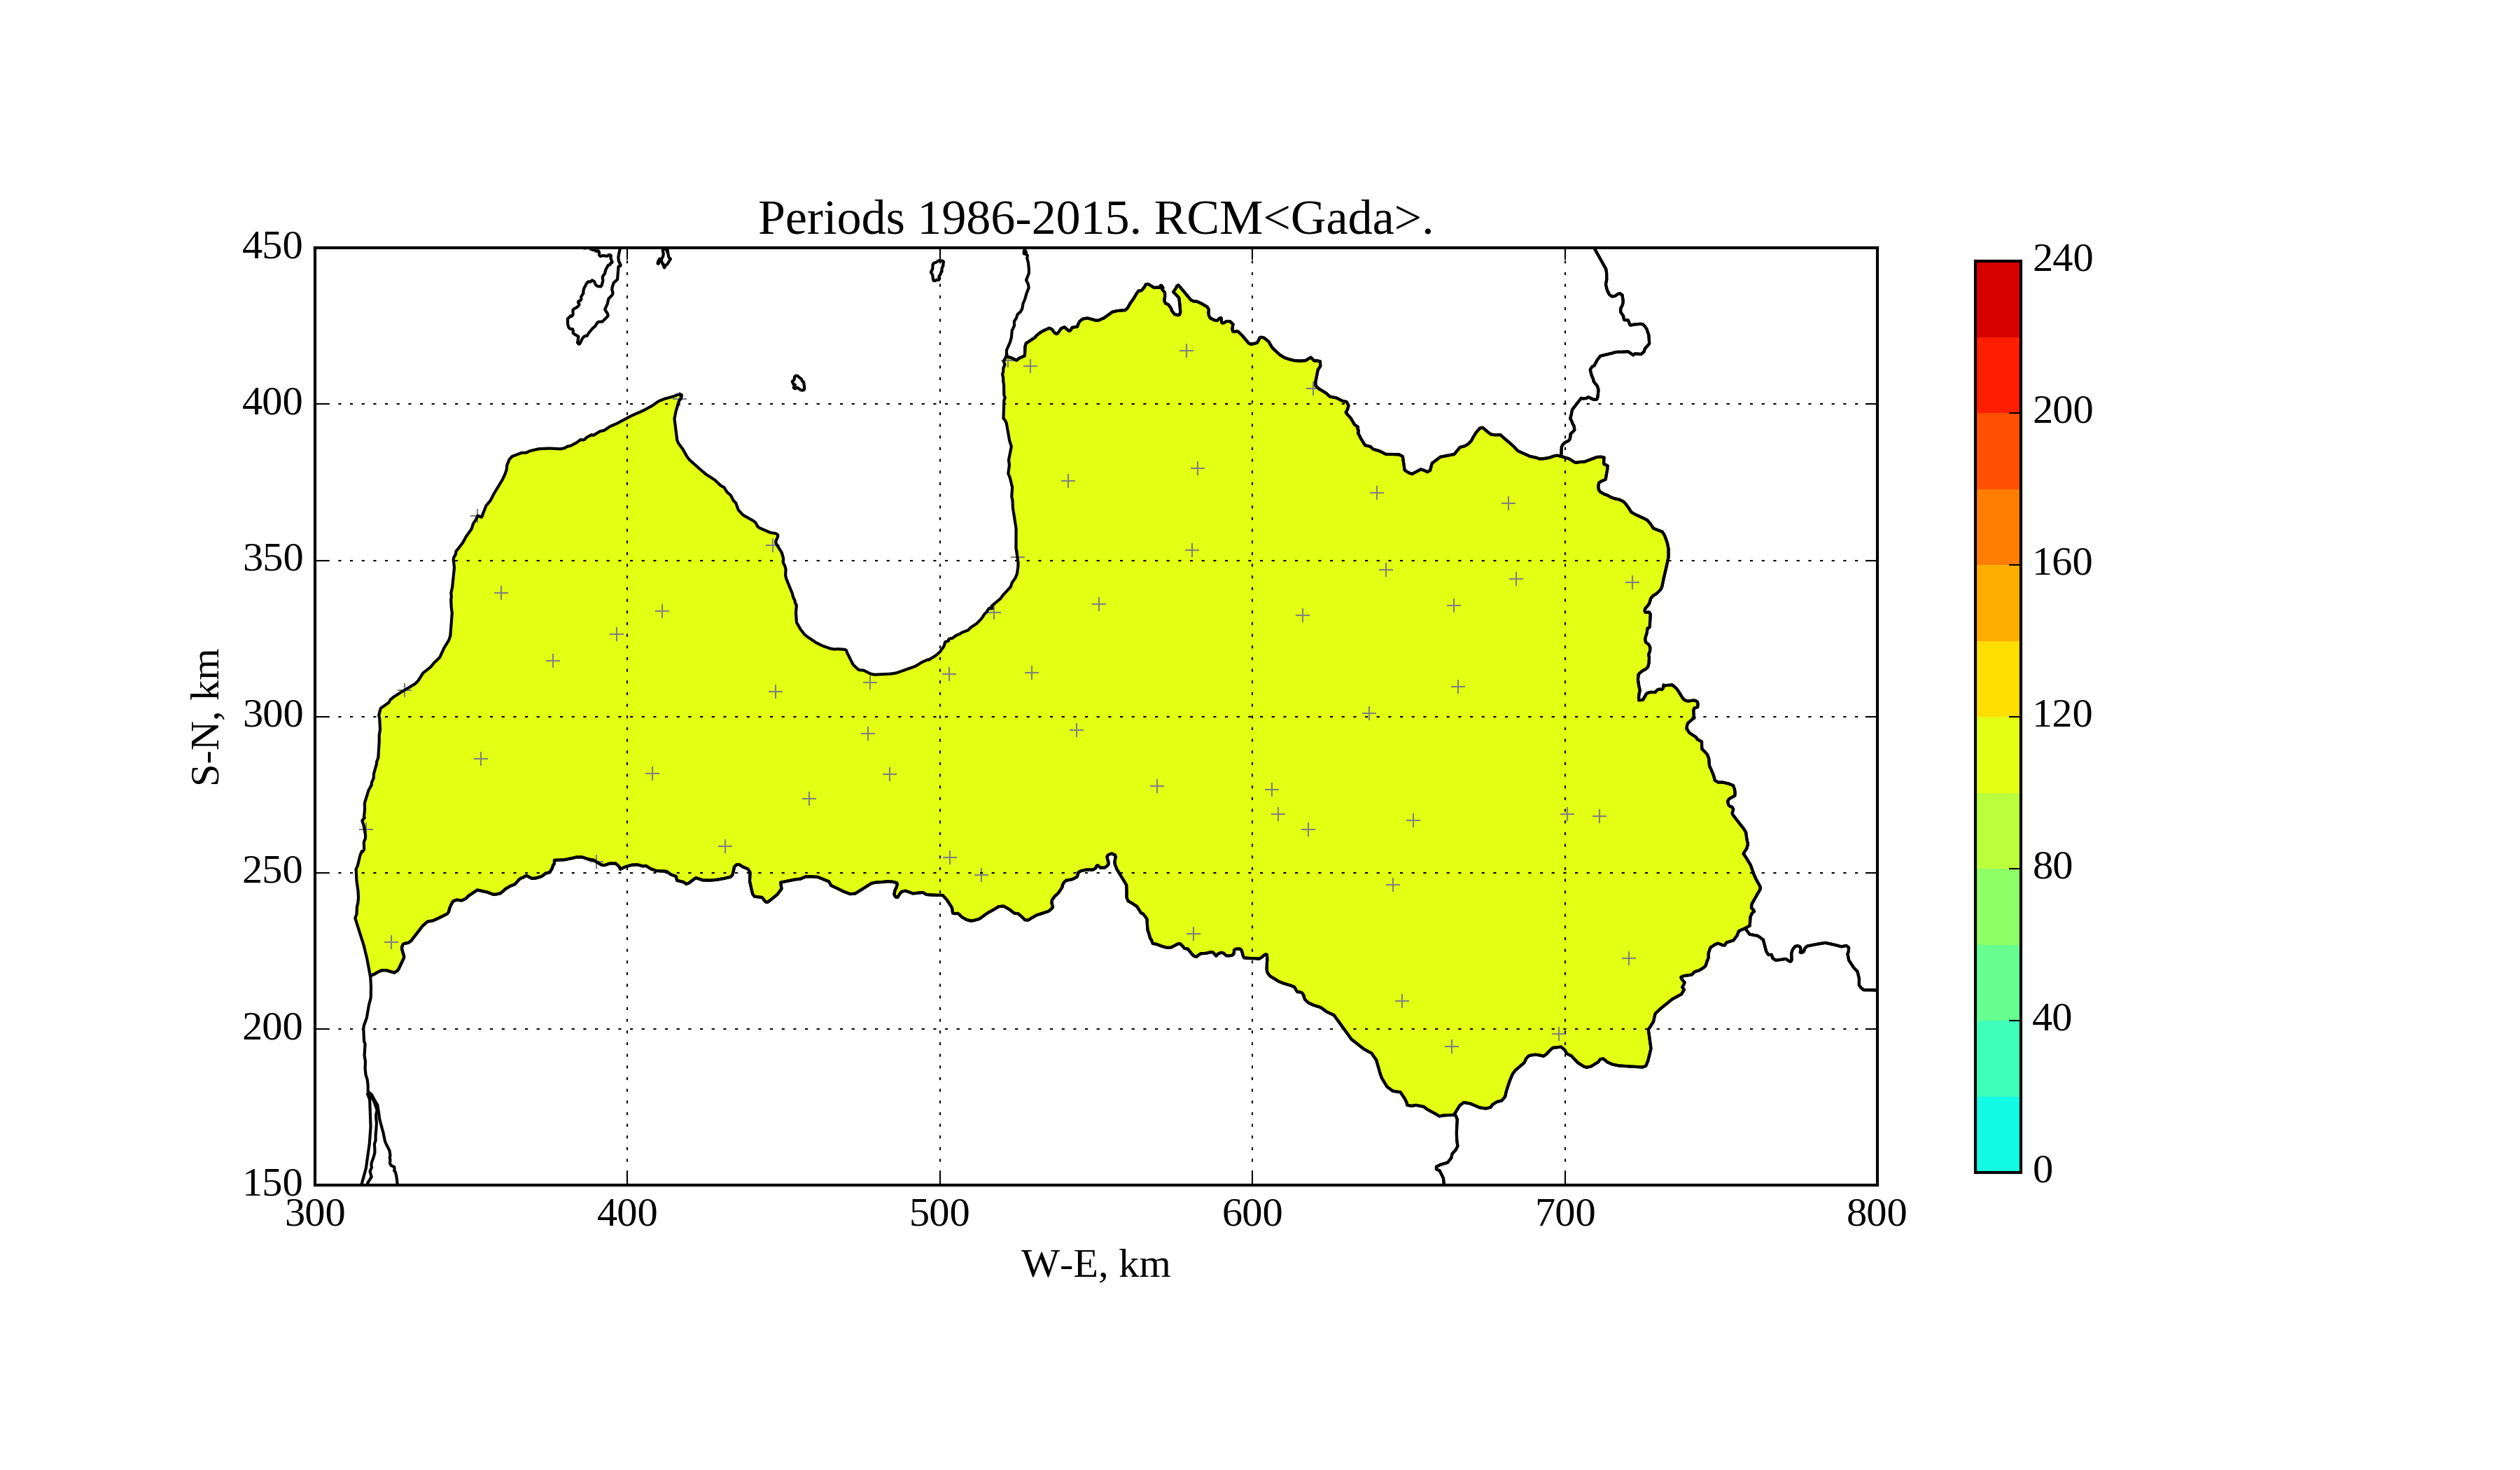
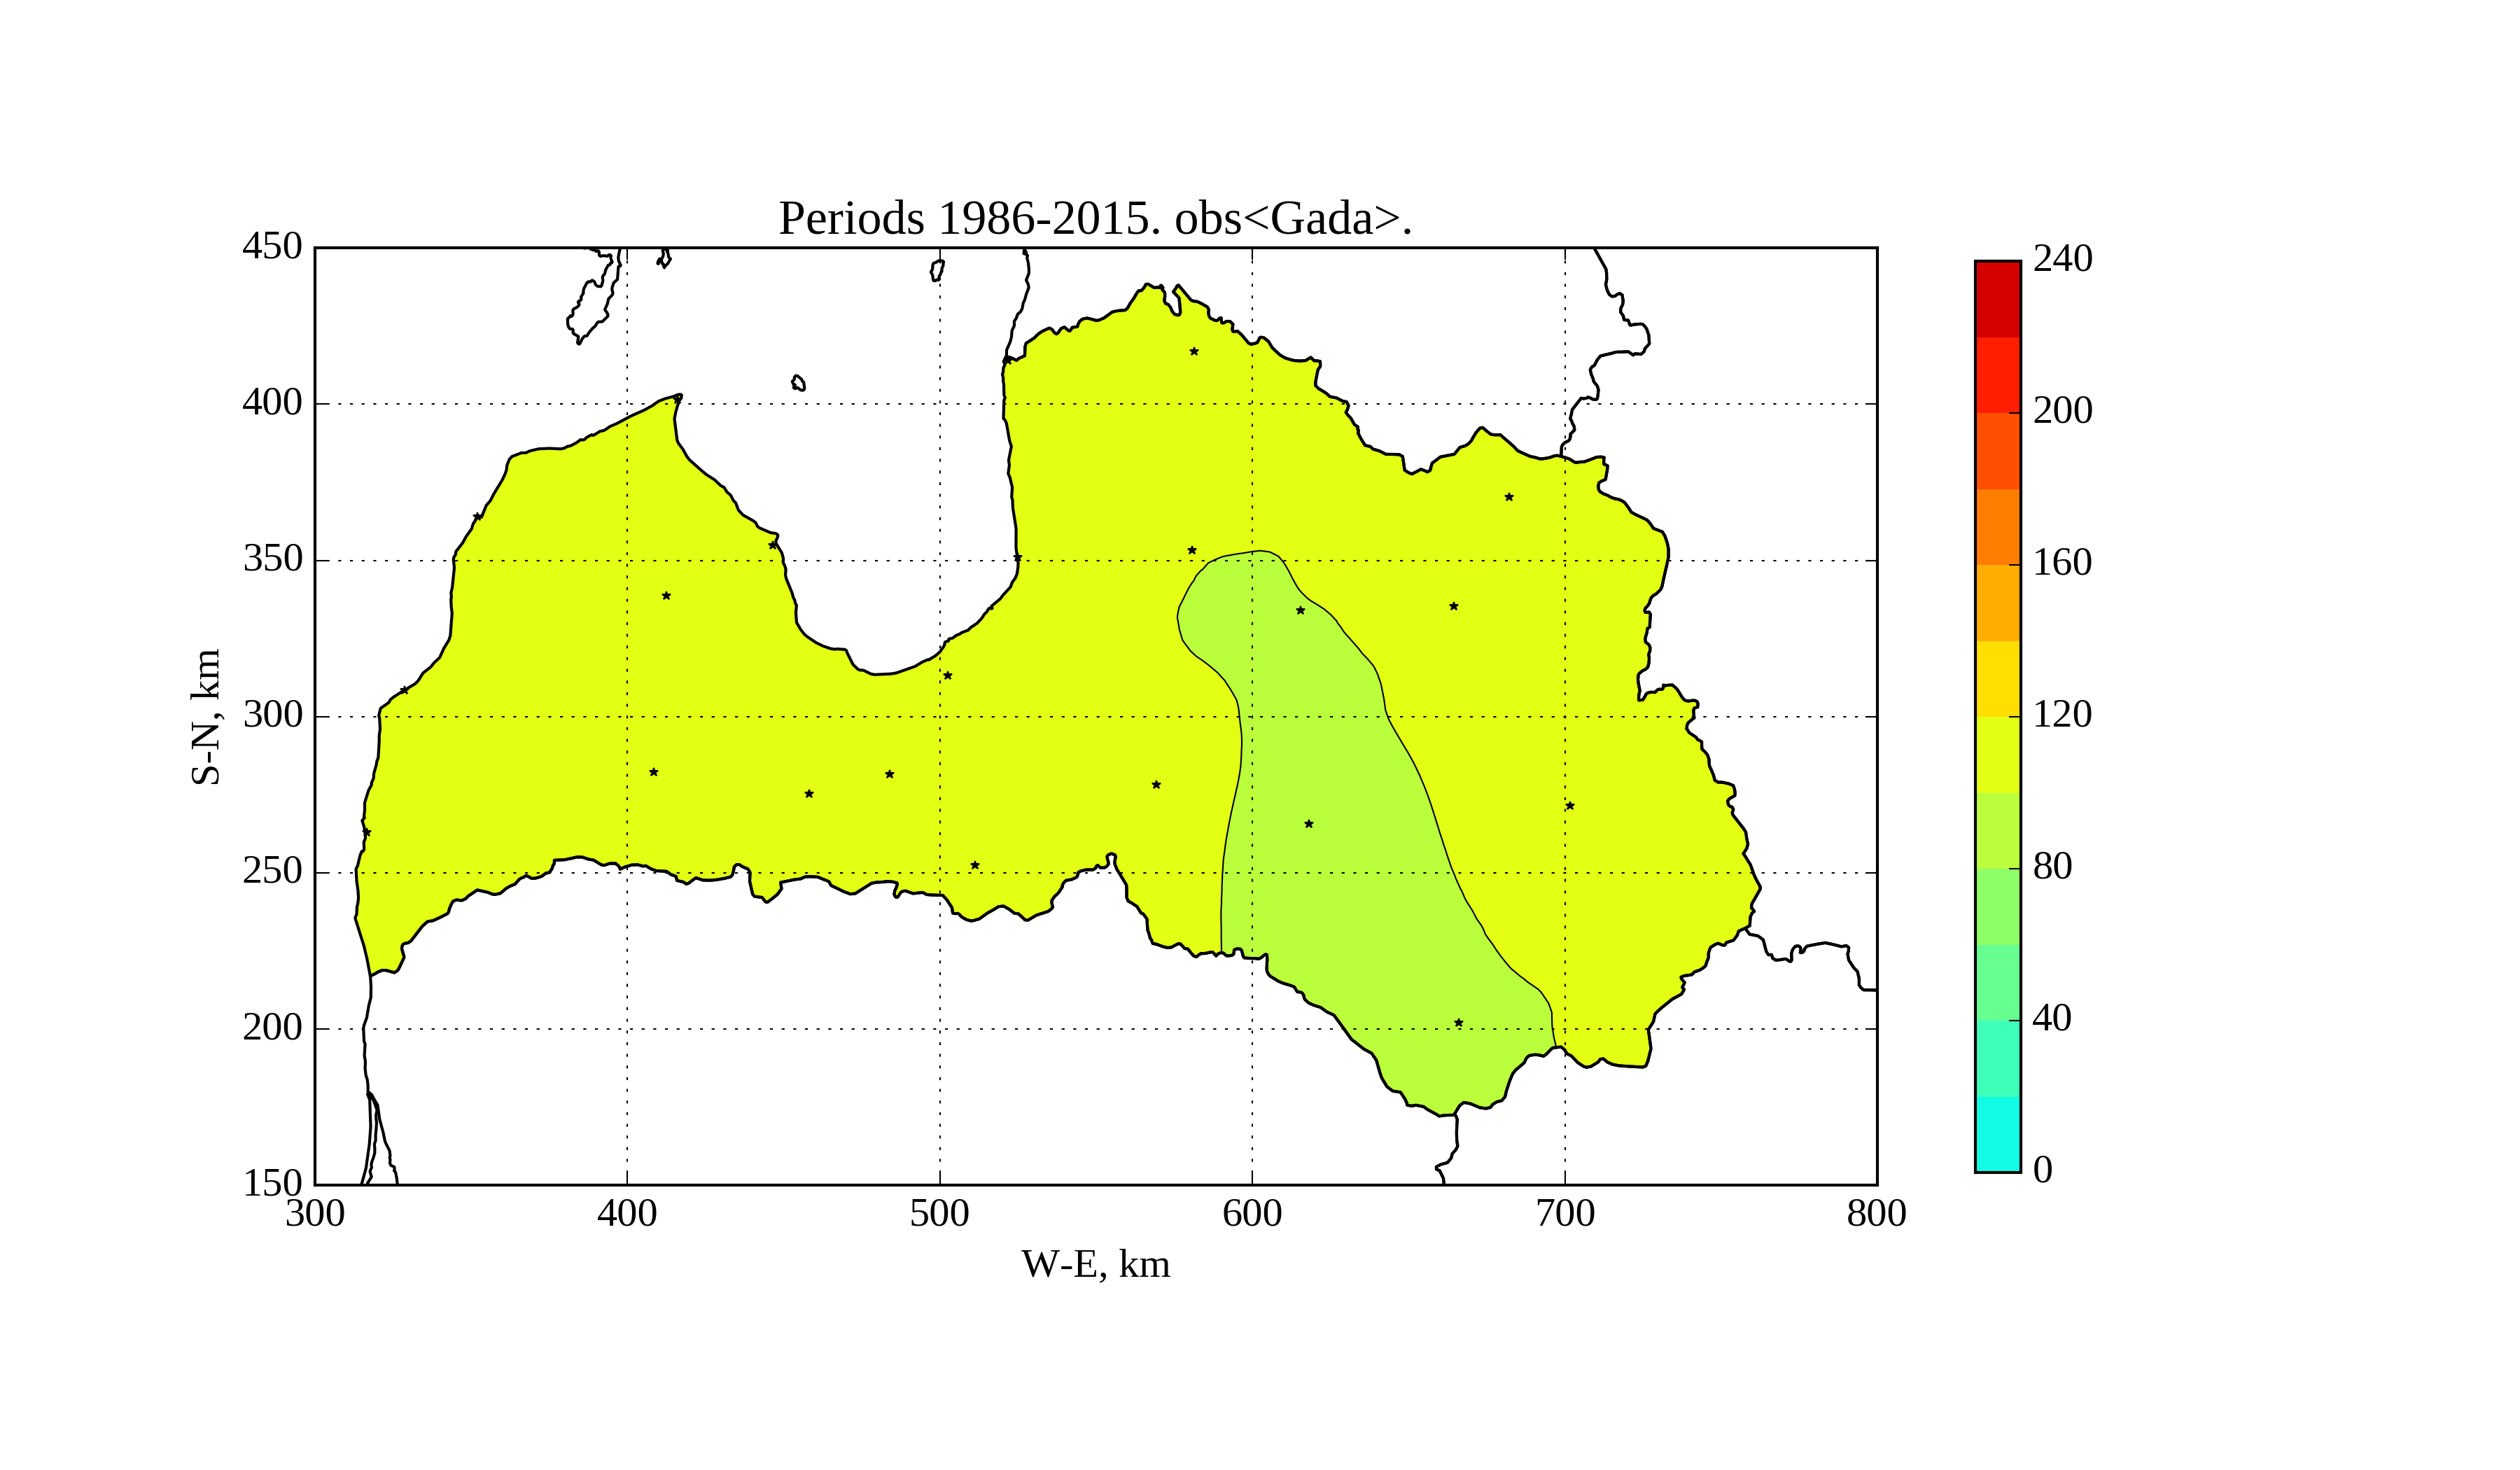
Yearly average downward surface radiation maps in period 1986-2015 are shown in Figures 3-4 (RCM and derived obserbvations).
Figure 3. Yearly average solar irradiation [W/m^2] on horizontal surface in period 1986-2015 according to RCM
Figure 4. Yearly average solar irradiation [W/m^2] on horizontal surface in period 1986-2015 according to derived observations
The yearly average seems to match well between RCM and derived observations.
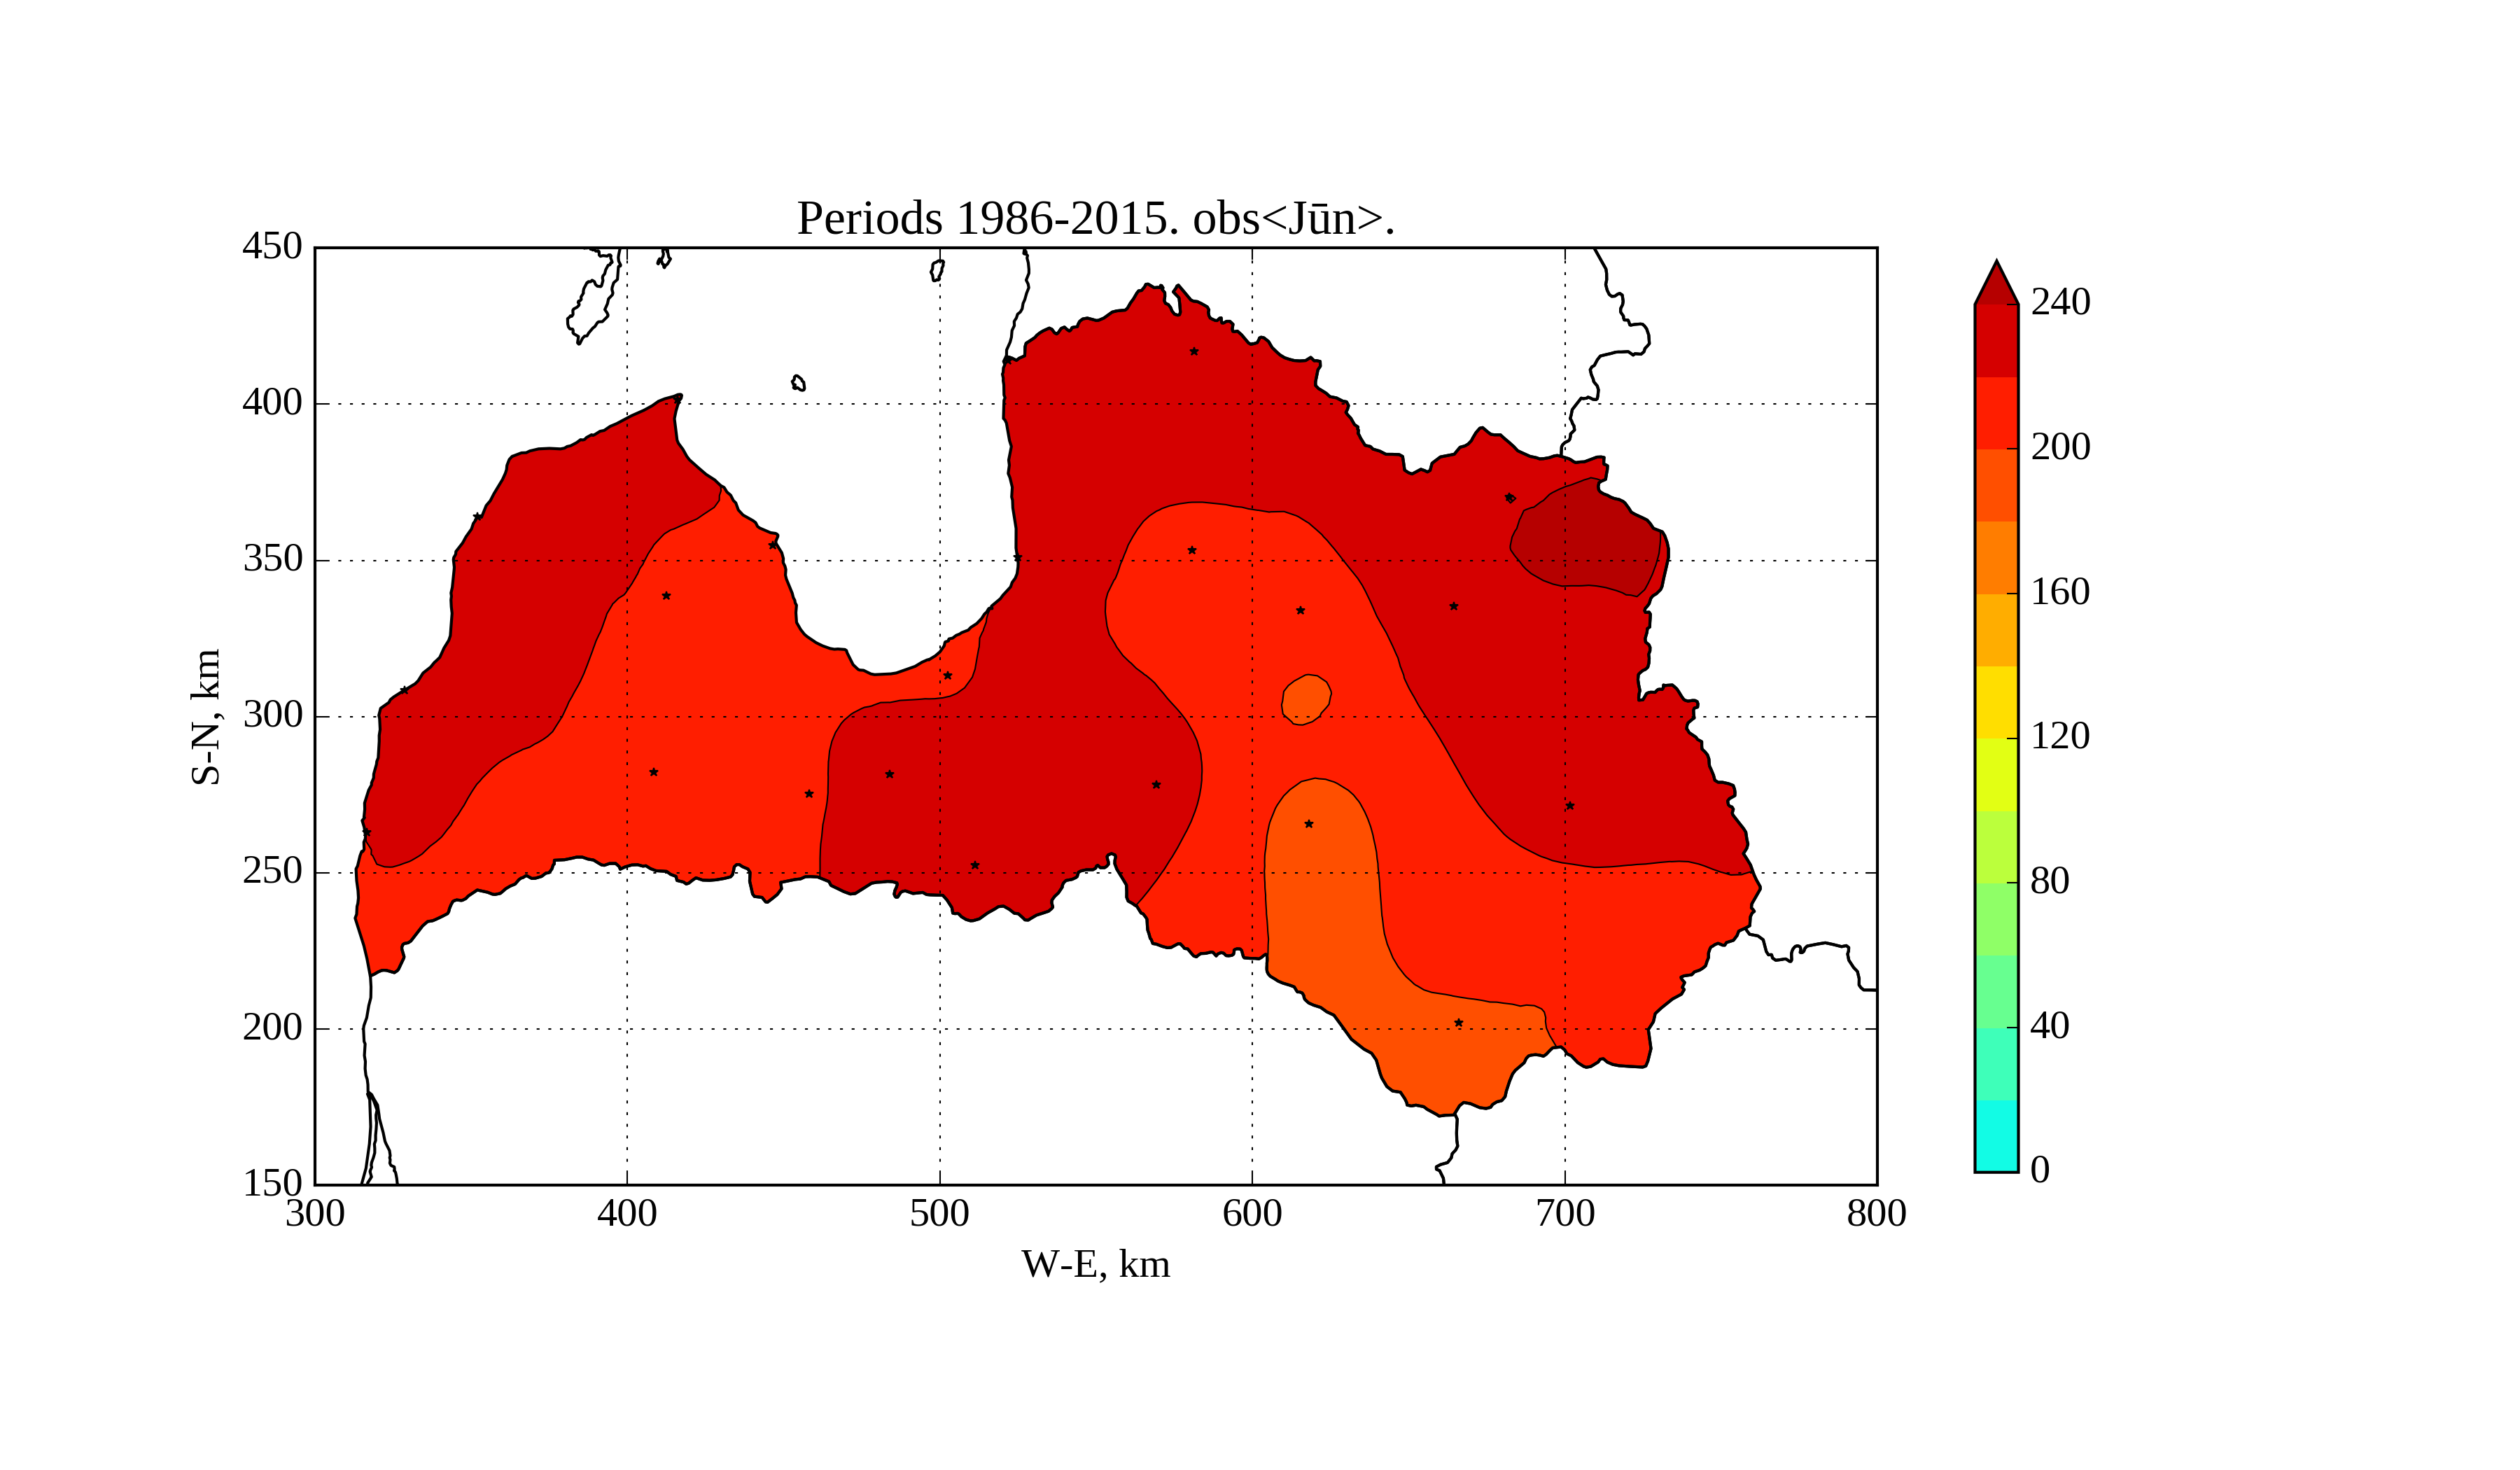
Now, let us check it for June in the same period 1986-2015 in Figures 5-6.
Figure 5. Average solar irradiation [W/m^2] on horizontal surface in June 1986-2015 according to RCM
Figure 6. Average solar irradiation [W/m^2] on horizontal surface in June 1986-2015 according to derived observations
Here, the subjective character of cloudiness observations comes more closely.
RCM shows rather uniform spatial distribution of solar radiation in June, except coastline where higher solar radiation occurs.
On the other hand, the observations show some strange minimums and maximums in certain stations
depending on the subjctive character of these observations. North-south gradient can barely be seen due to small area of Latvia.
Climatological trends
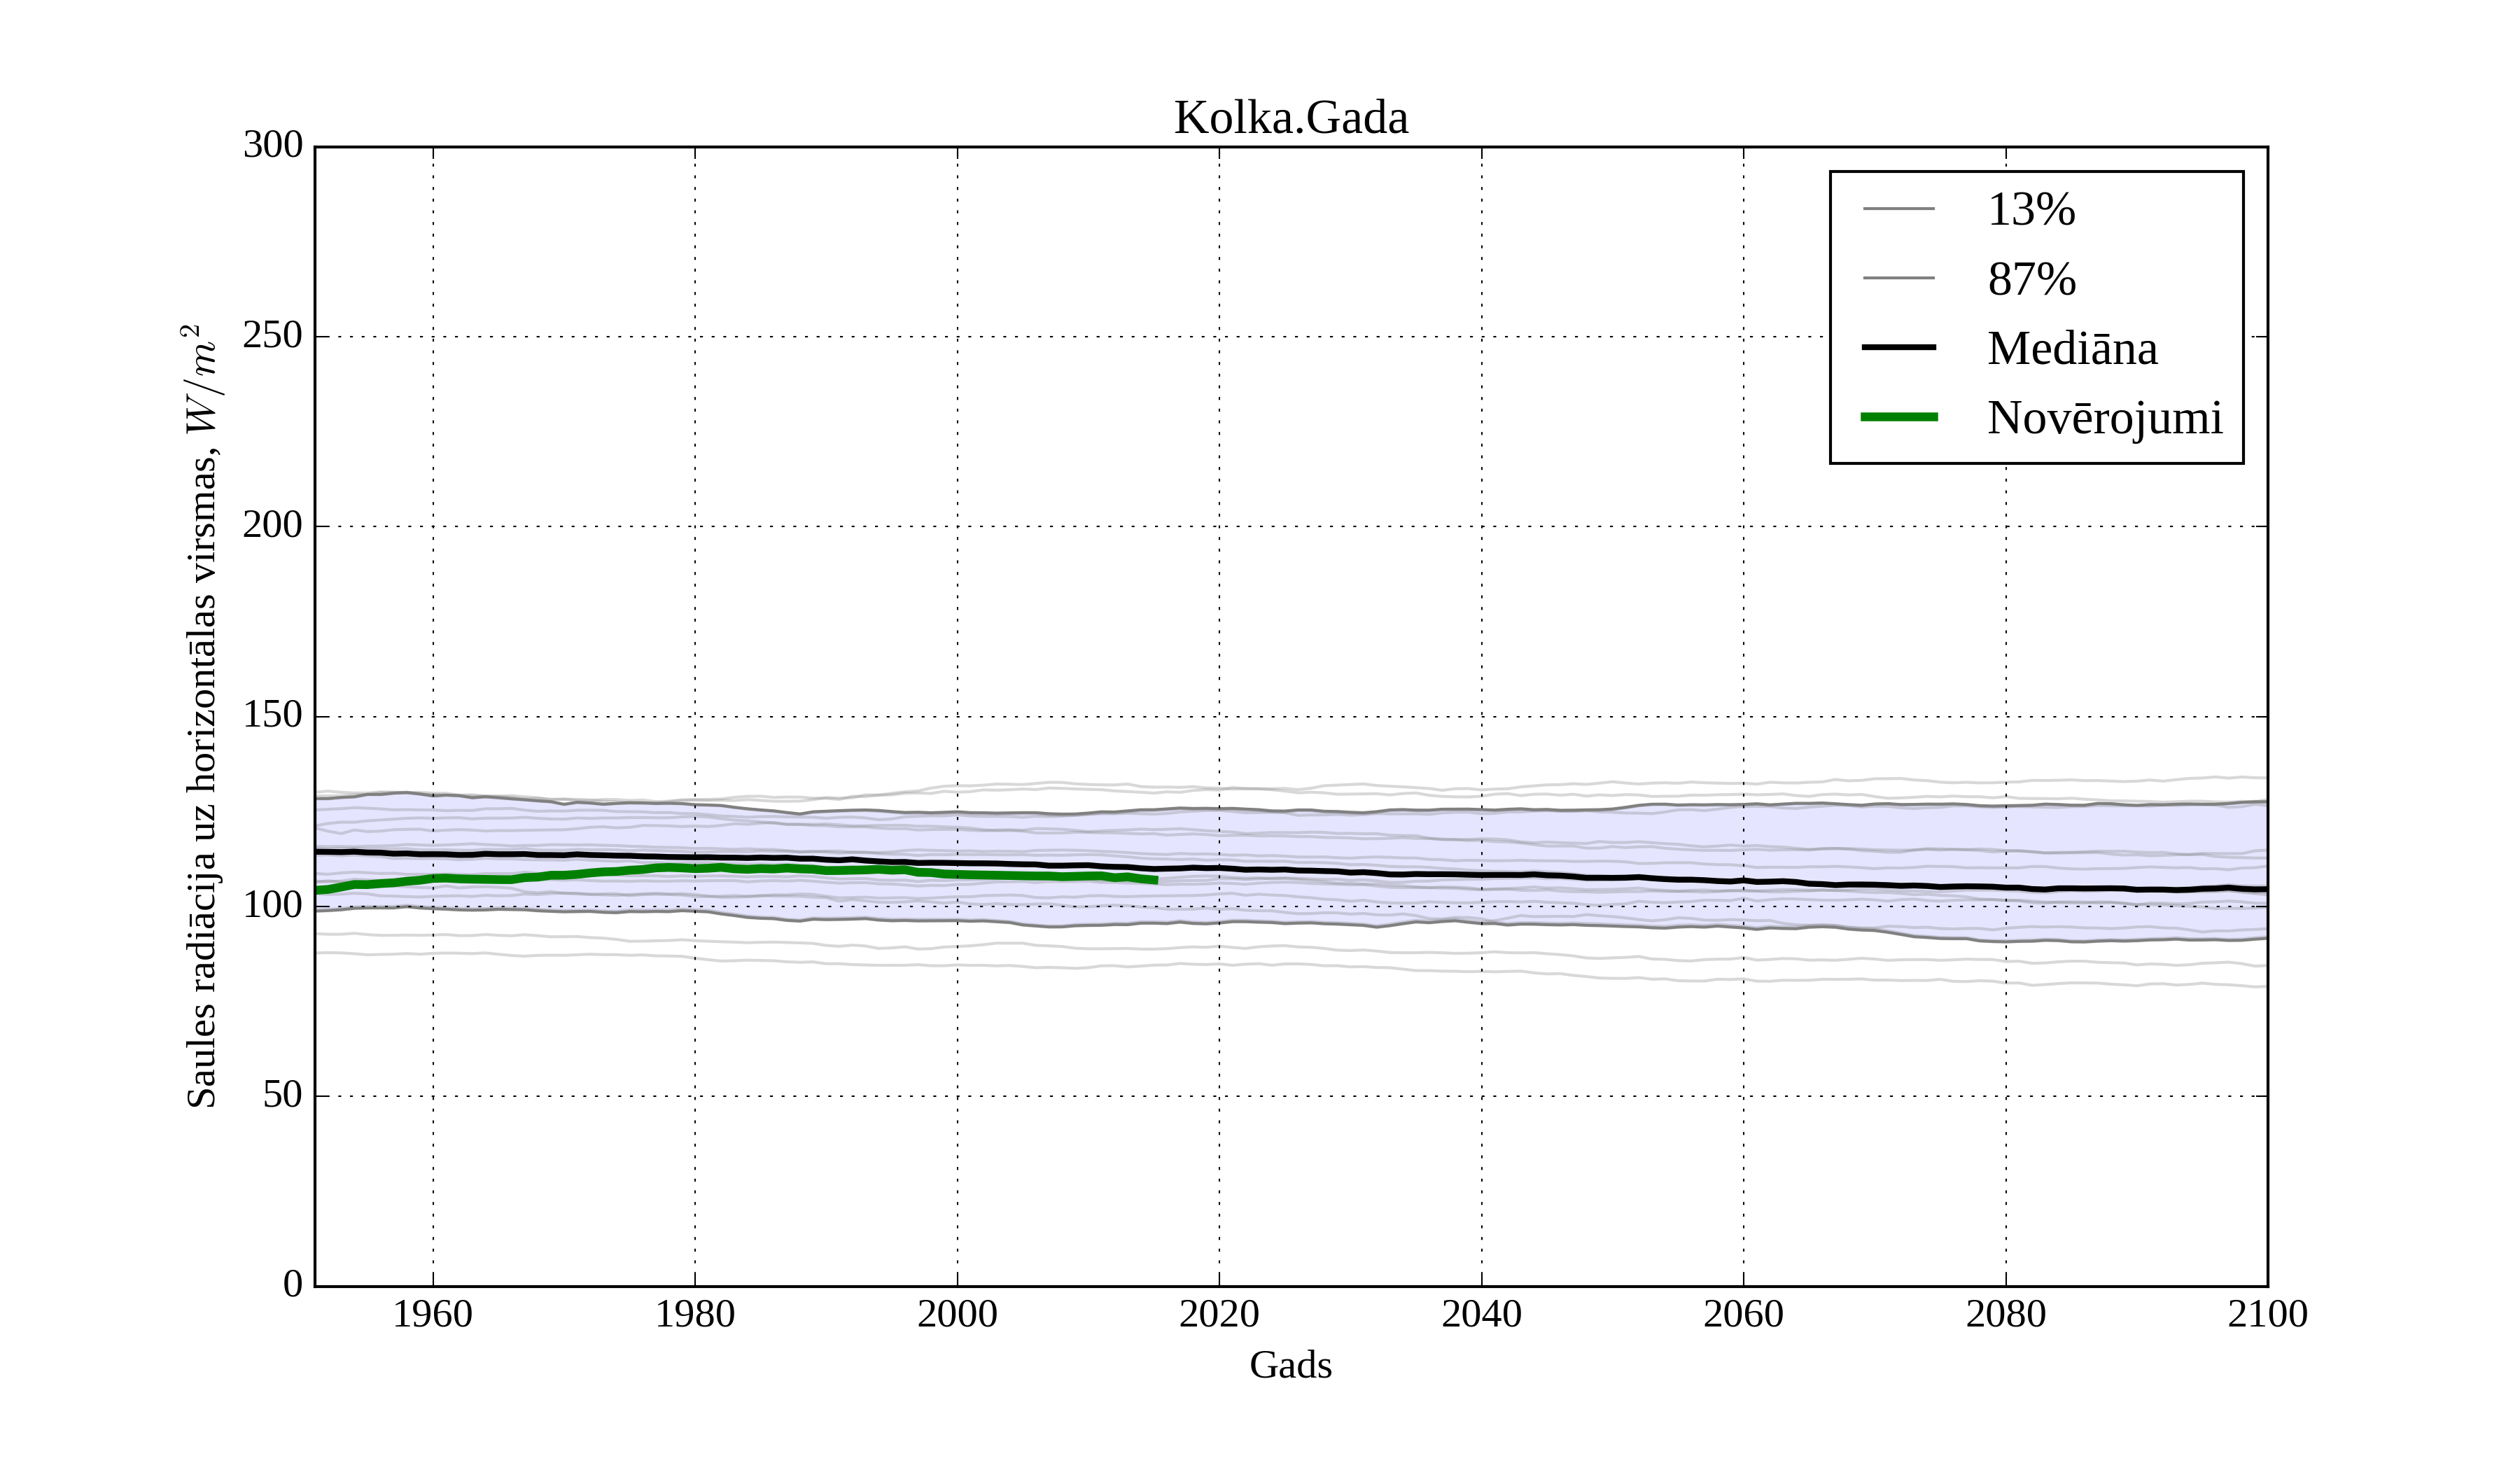
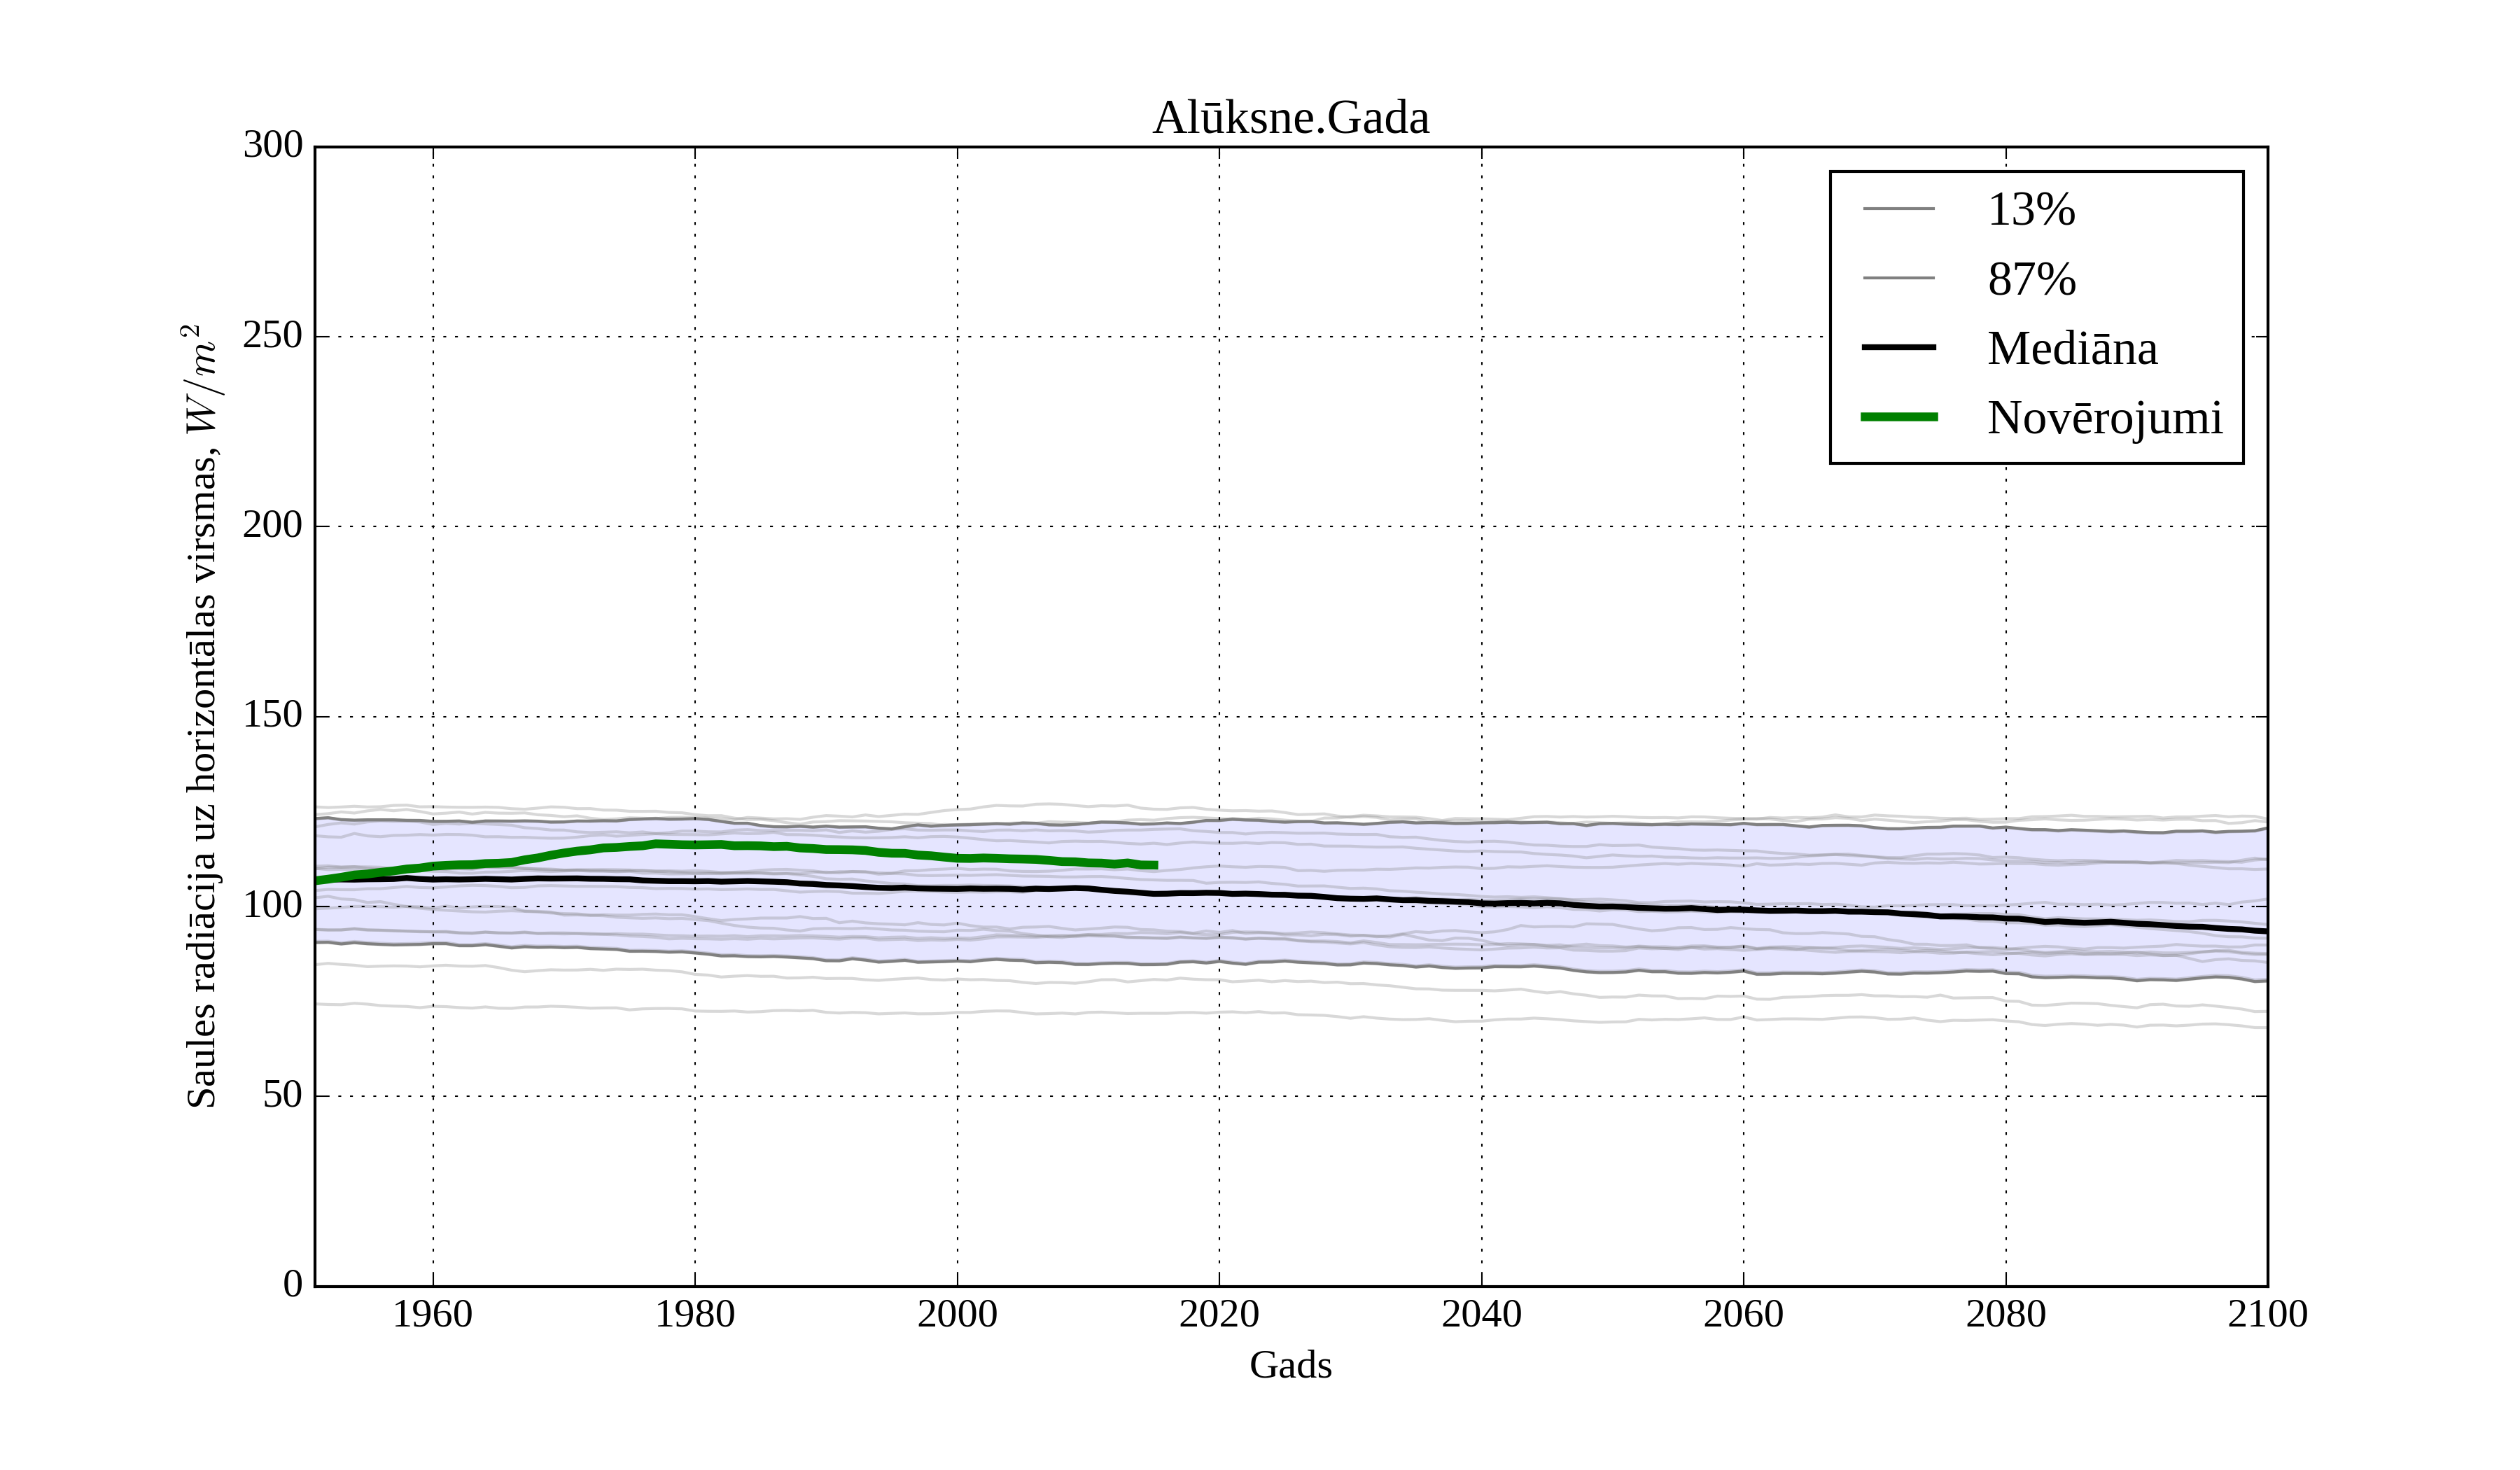
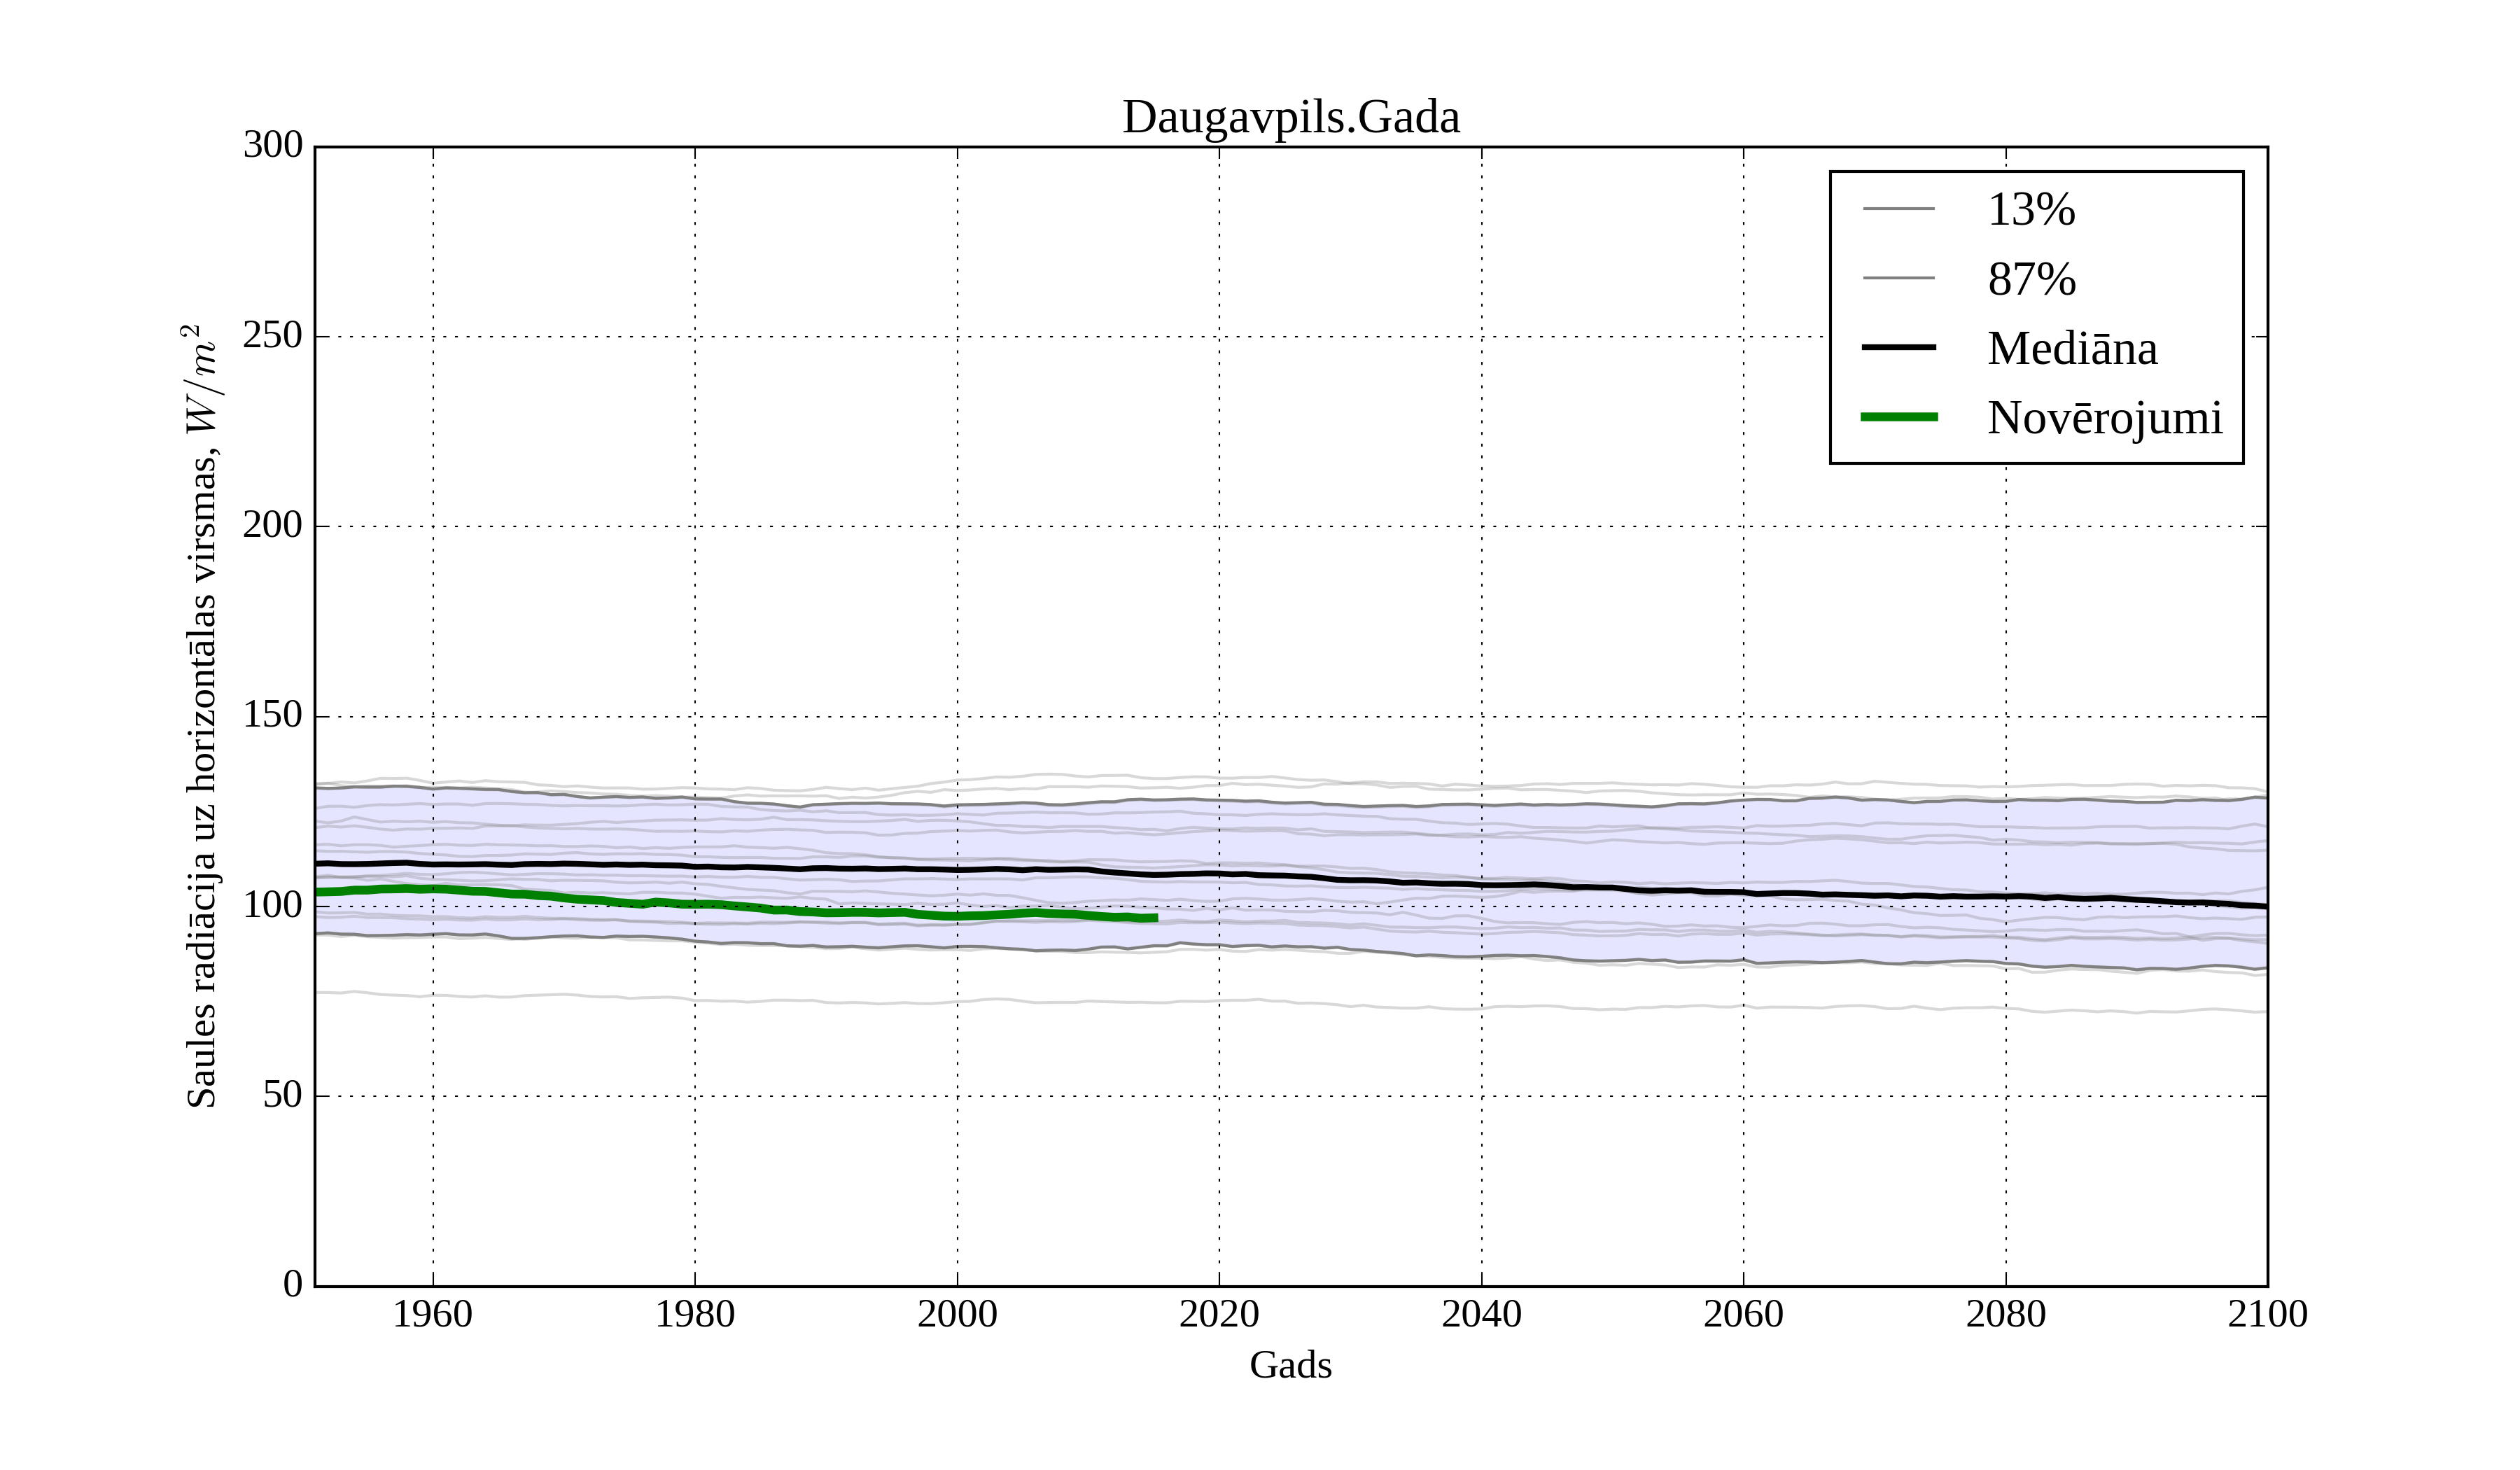
Let us now check the trends of solar radiations both of RCM and derived observations in stations of Latvia.
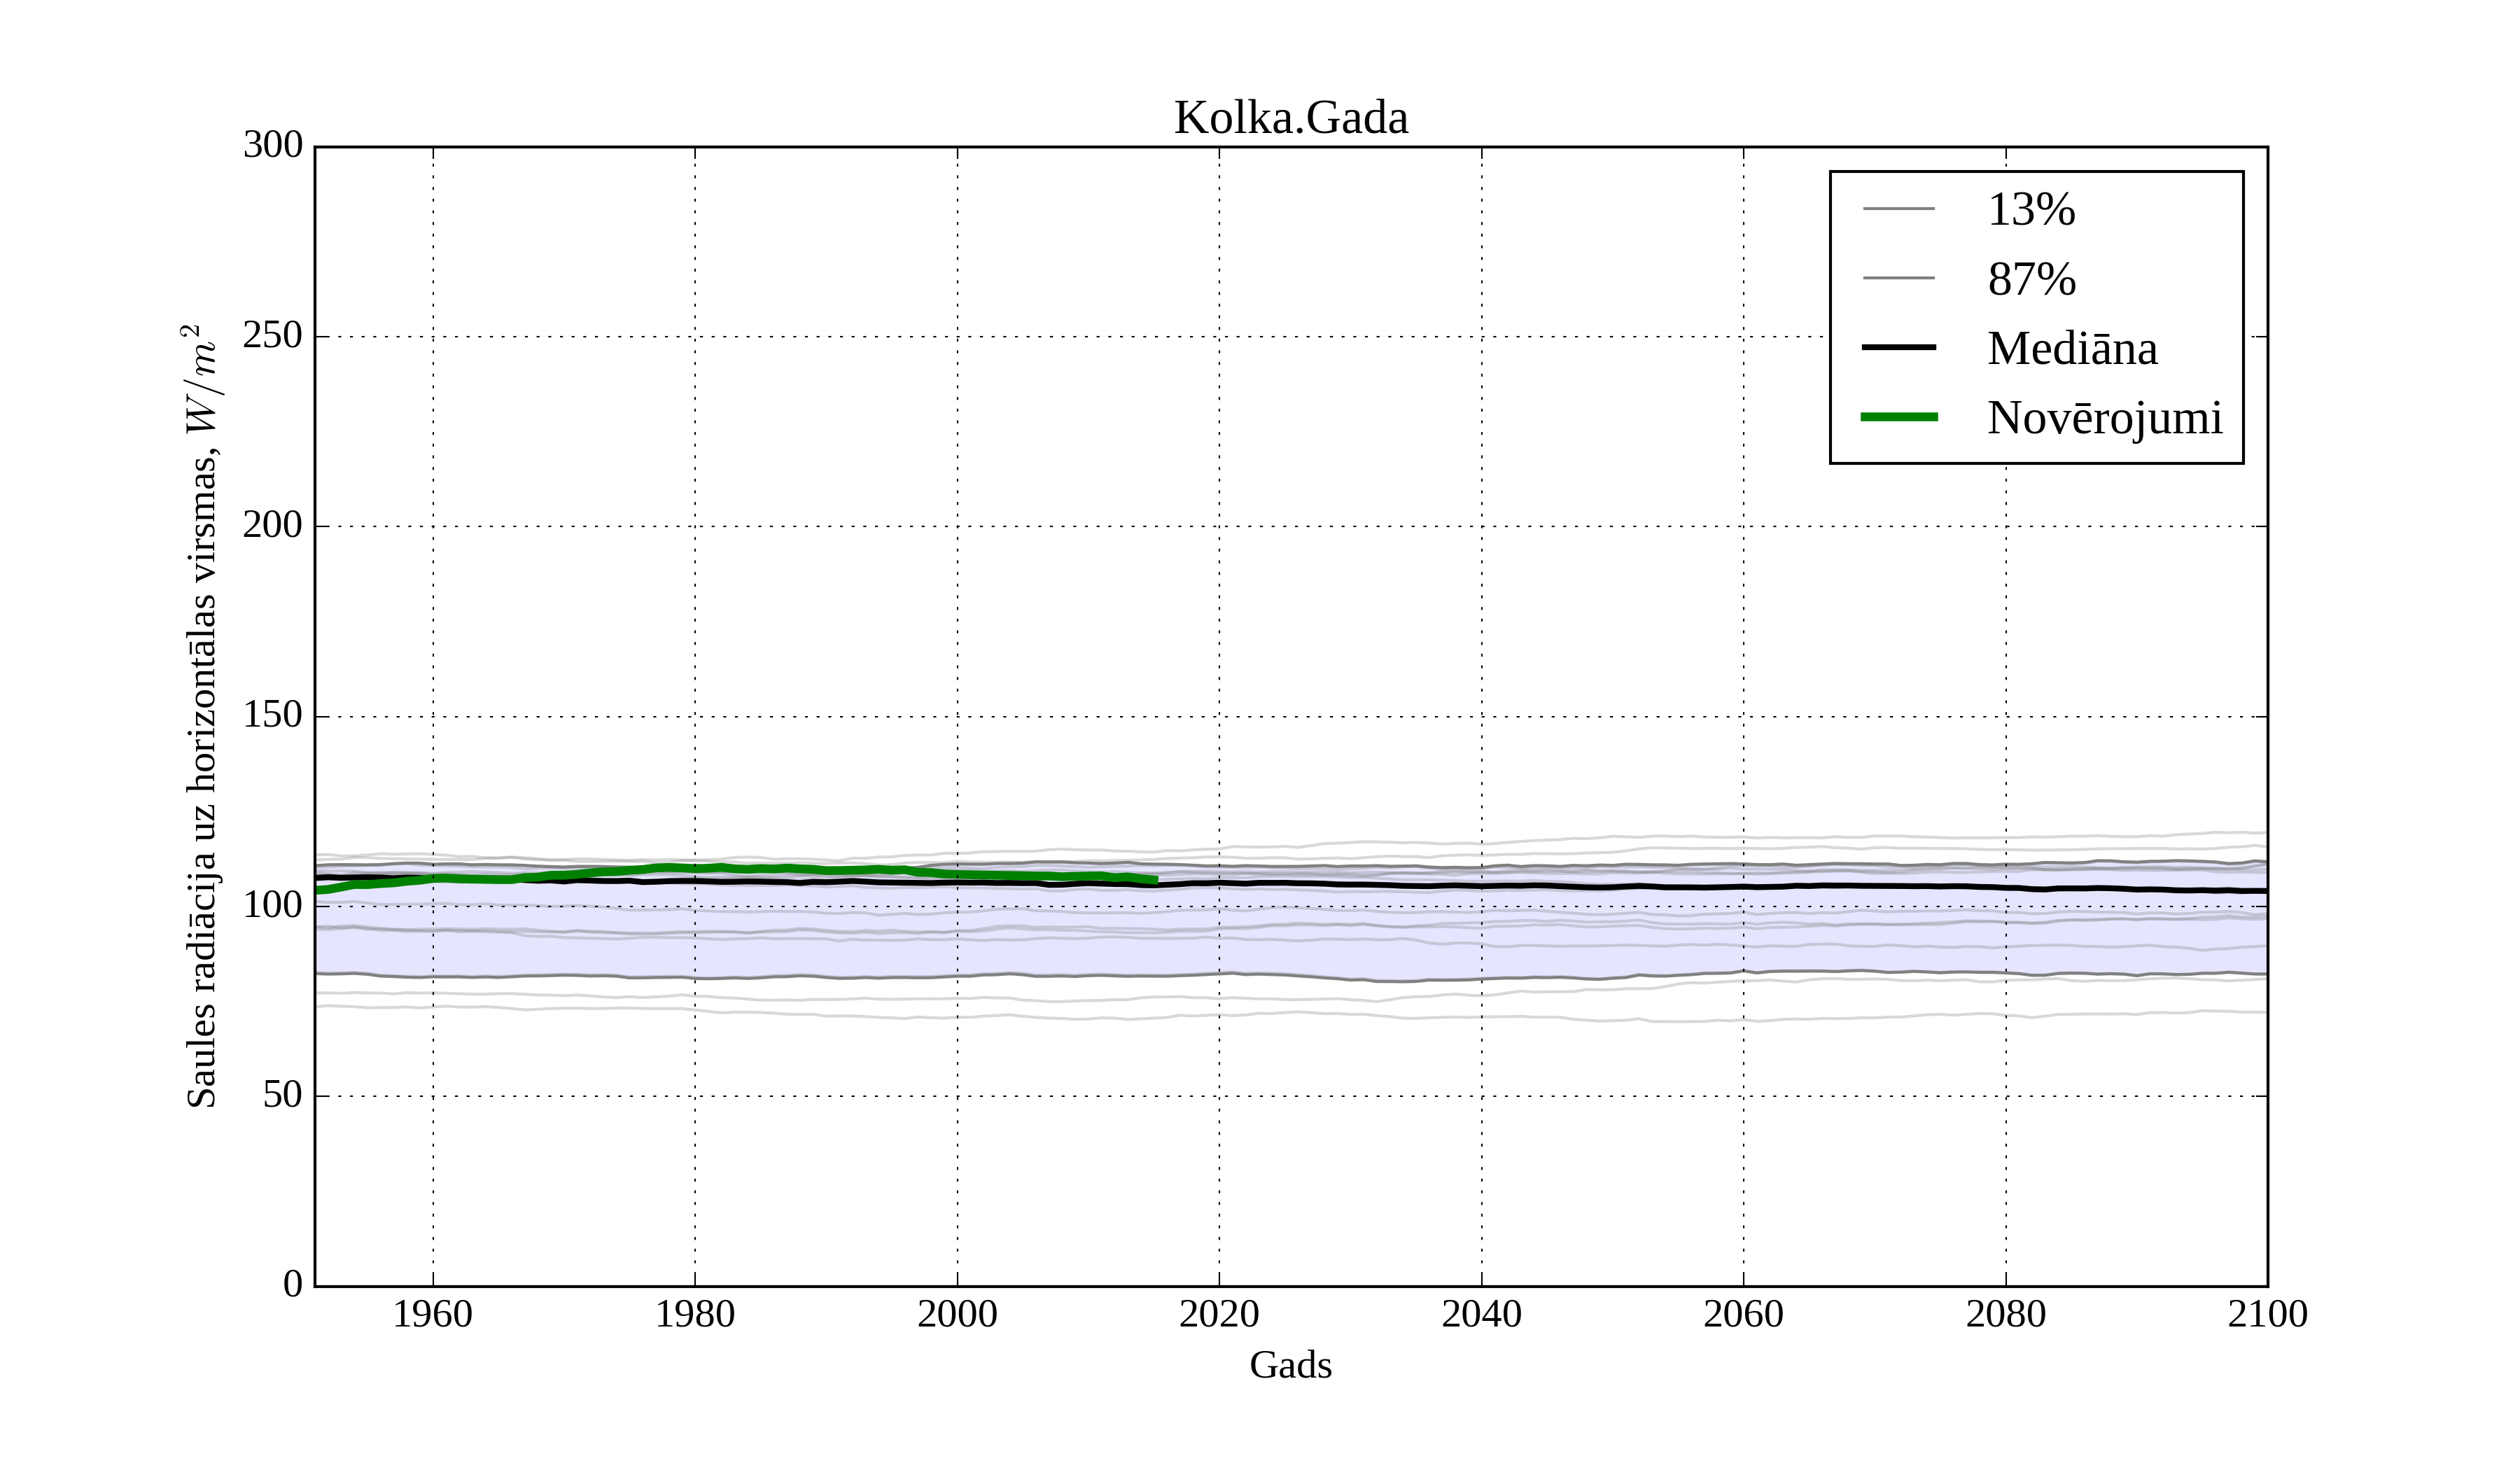
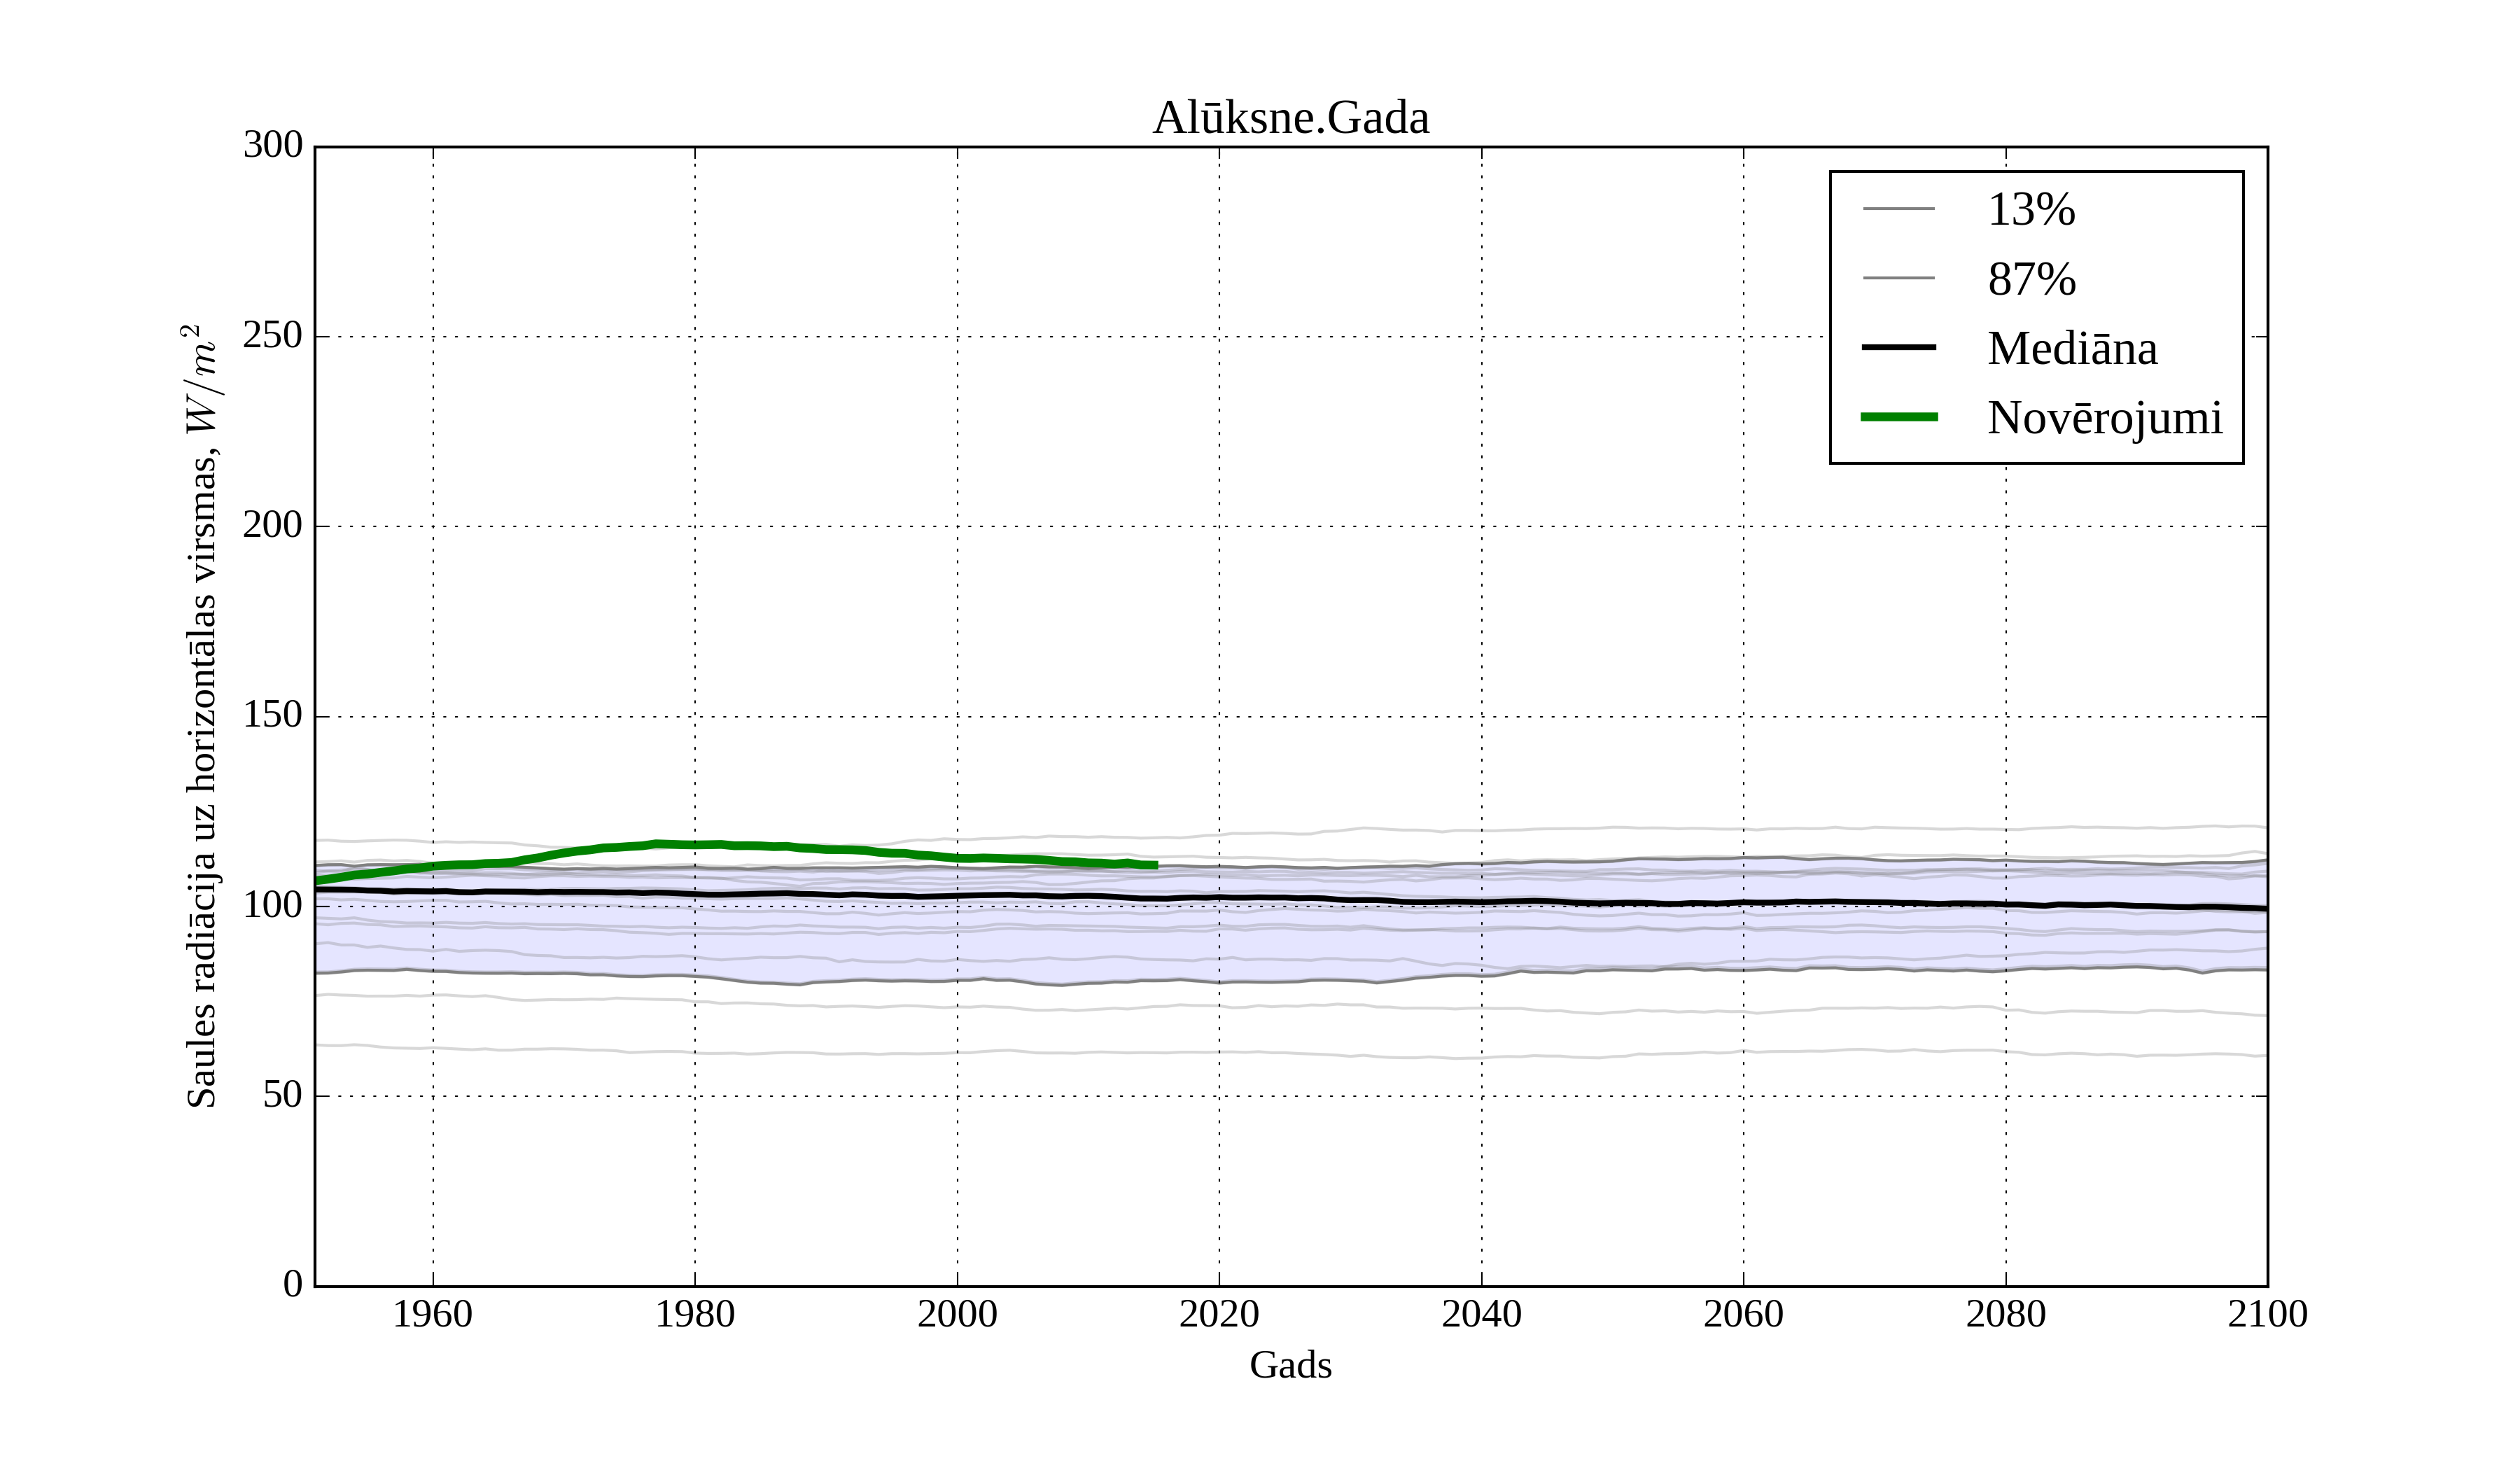
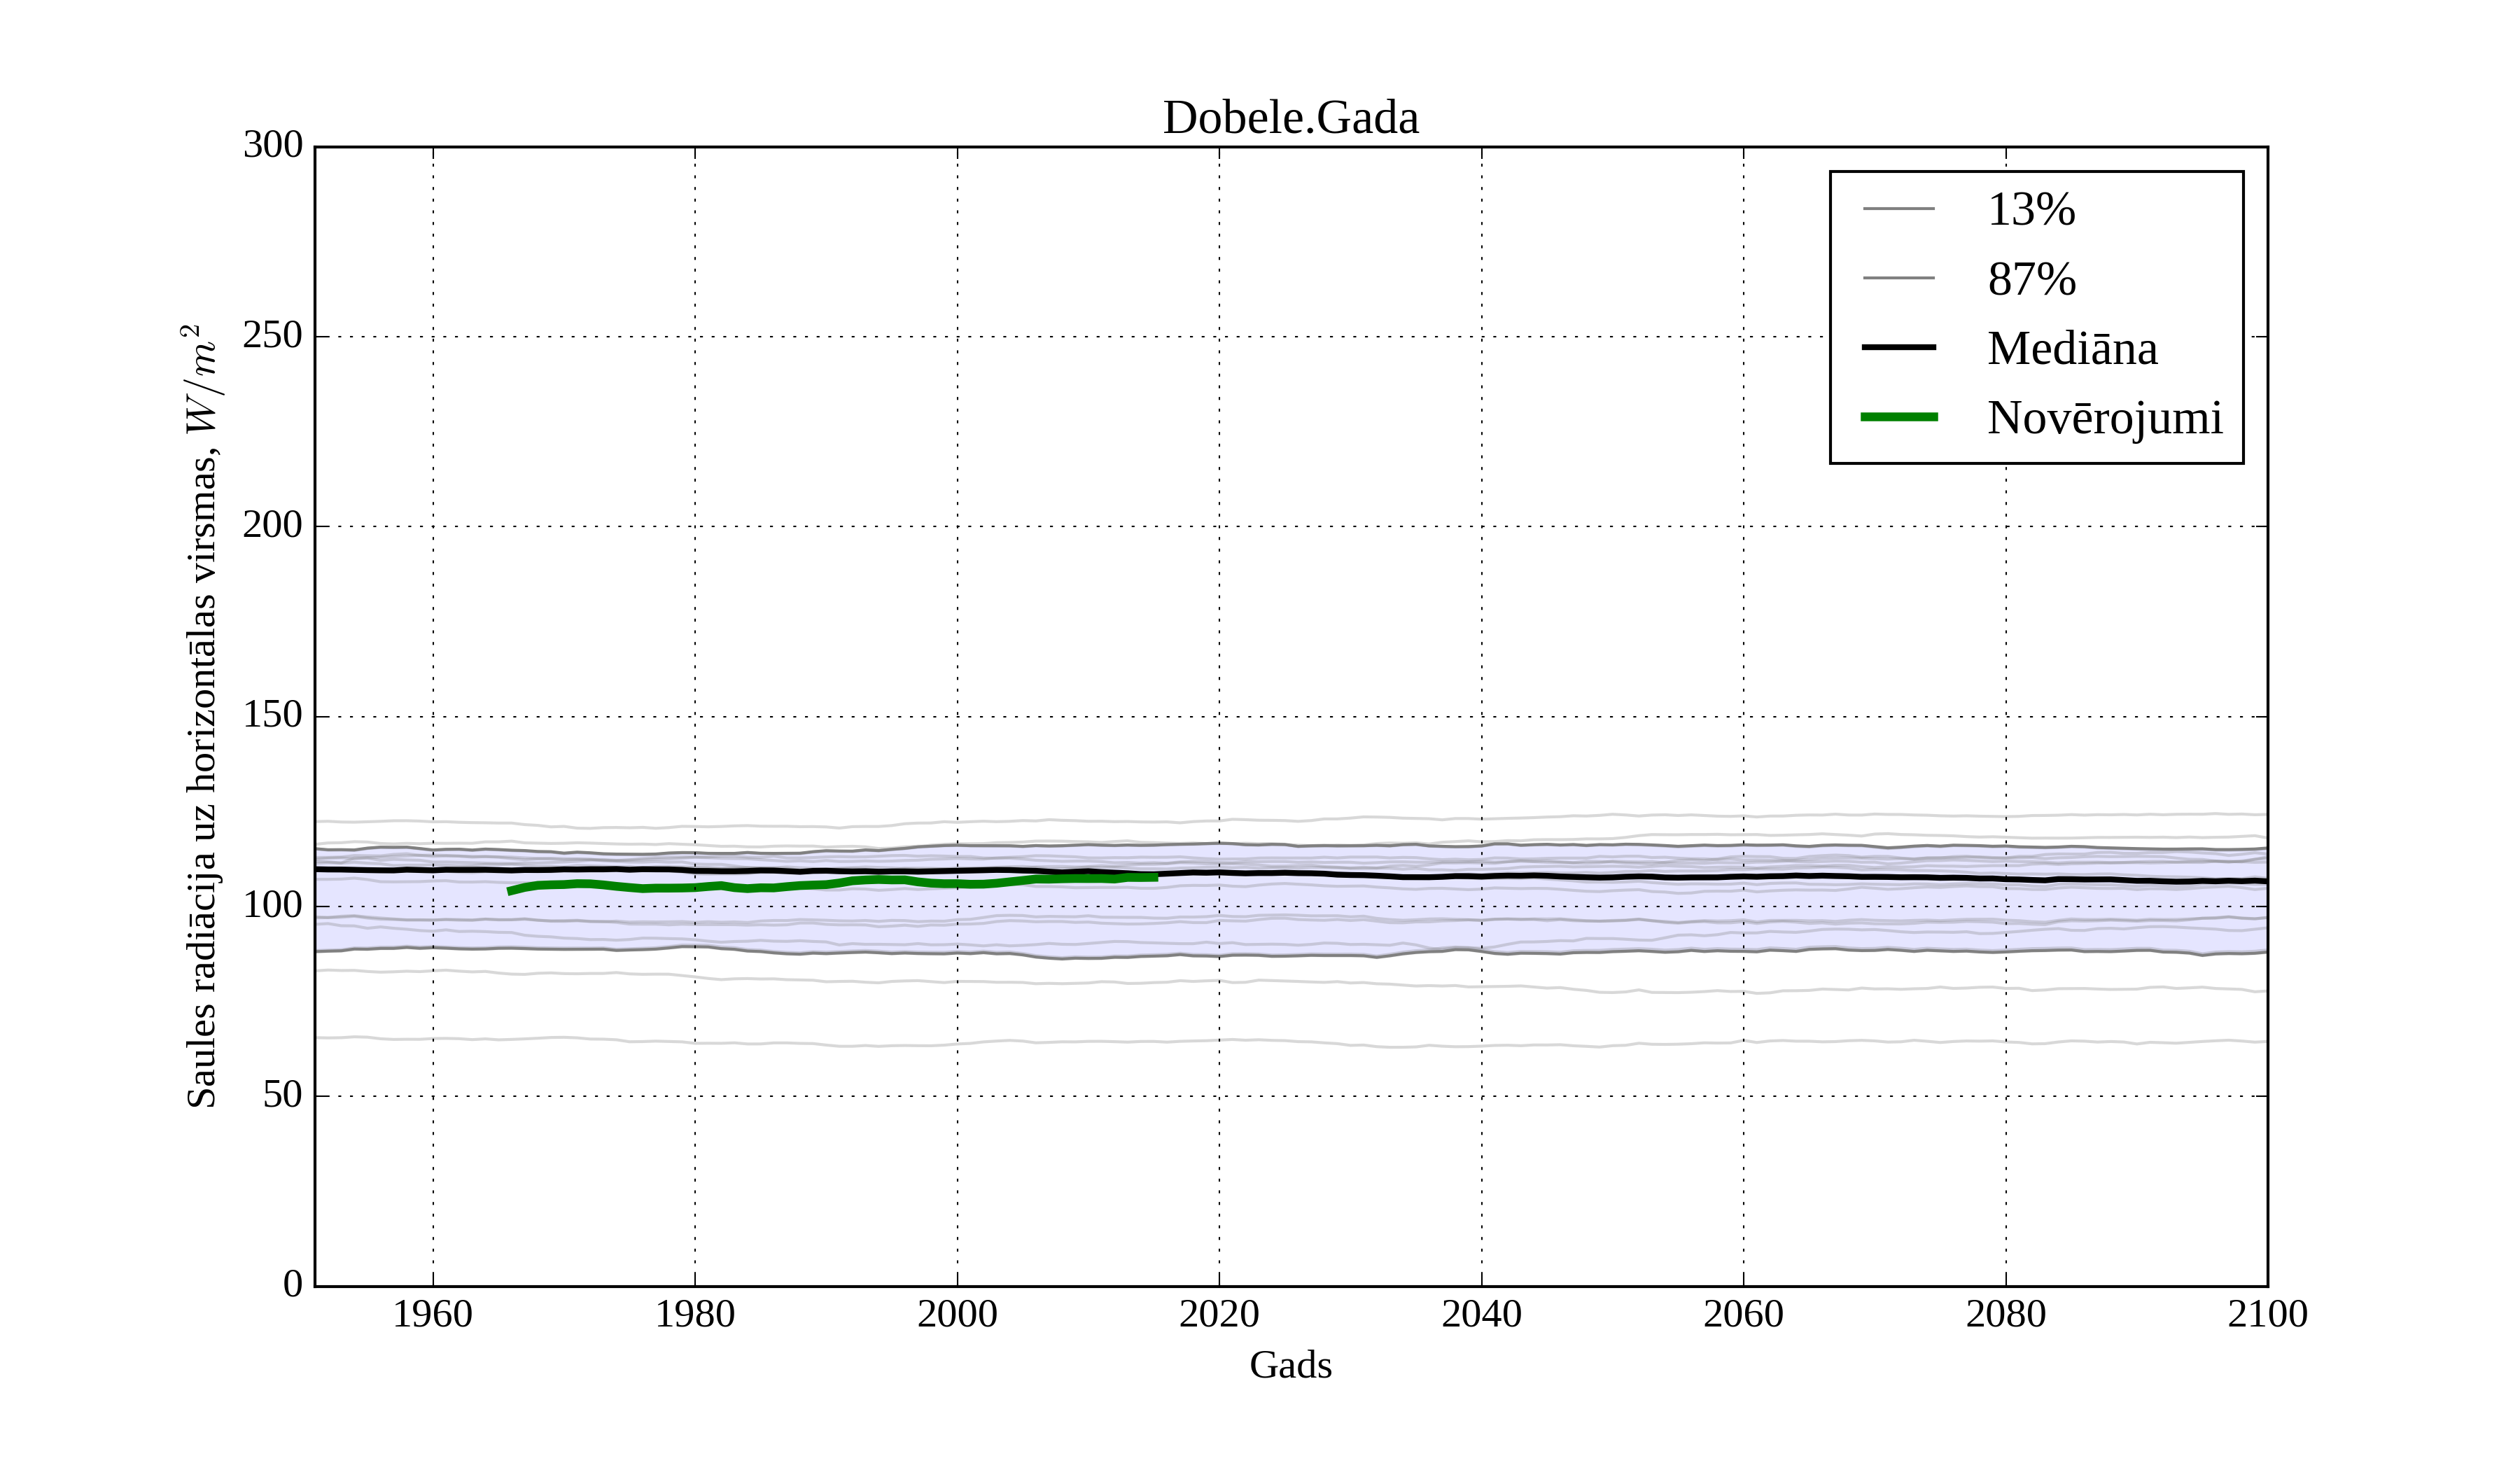
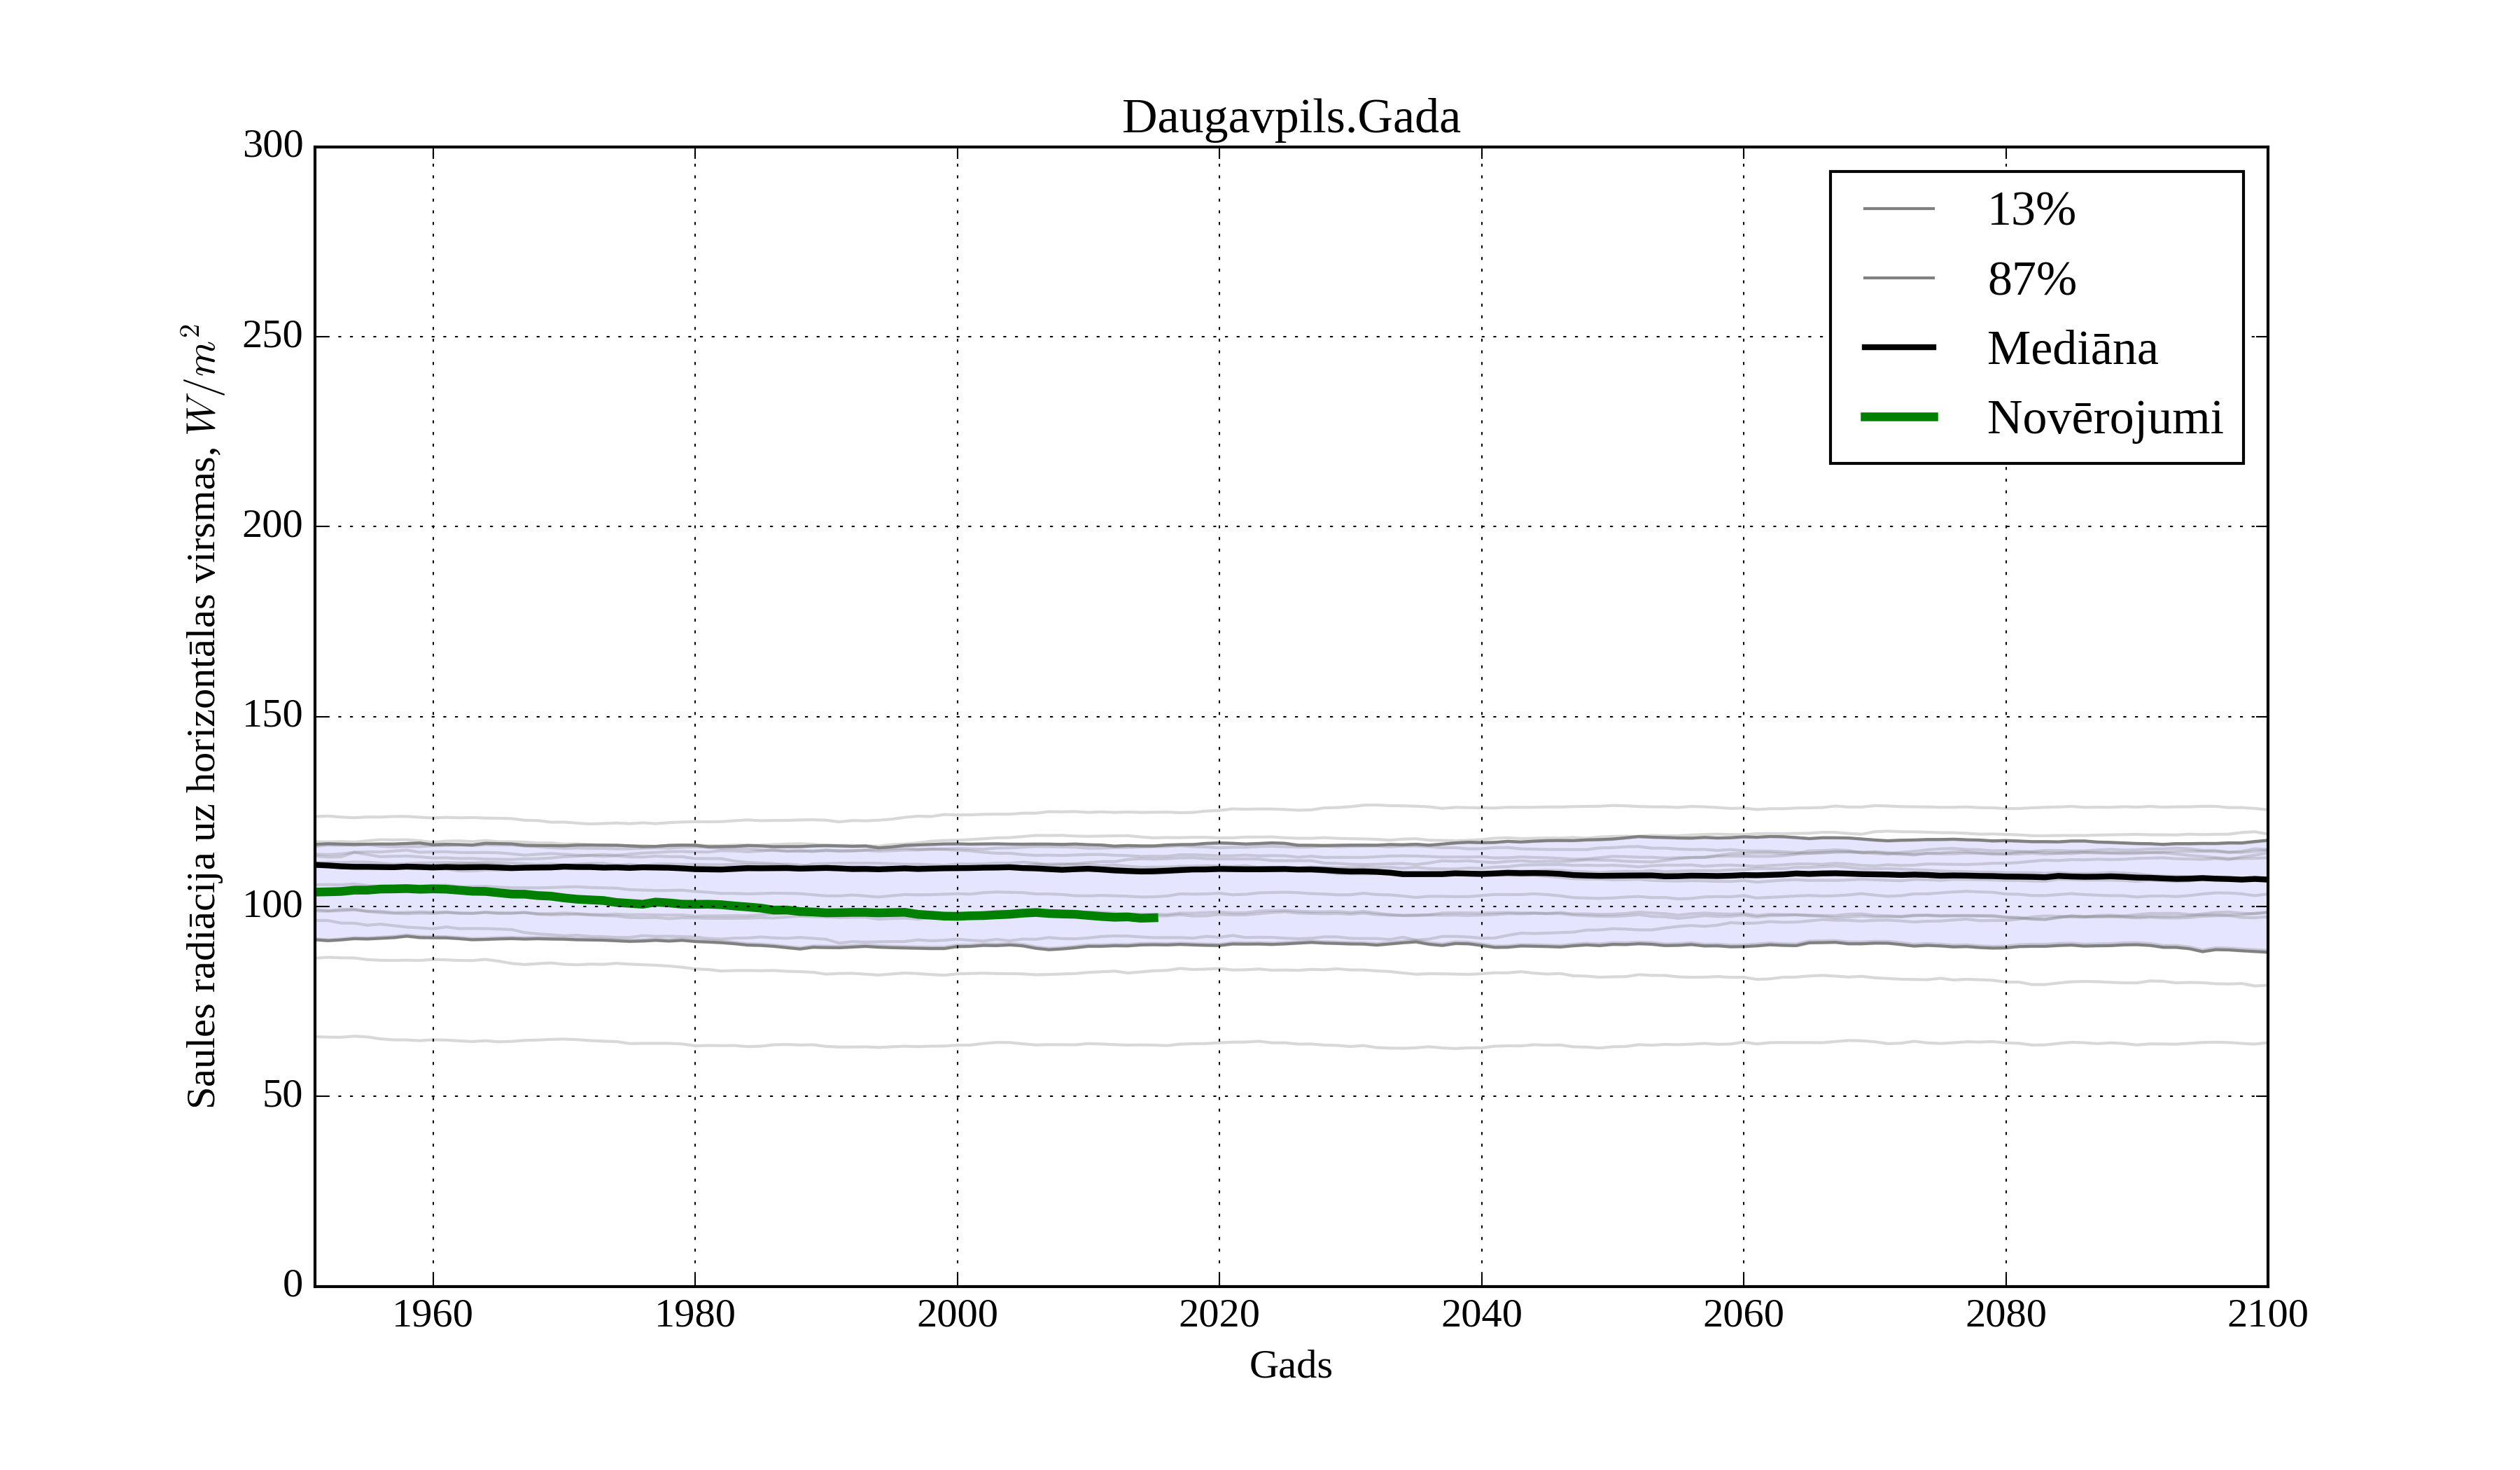
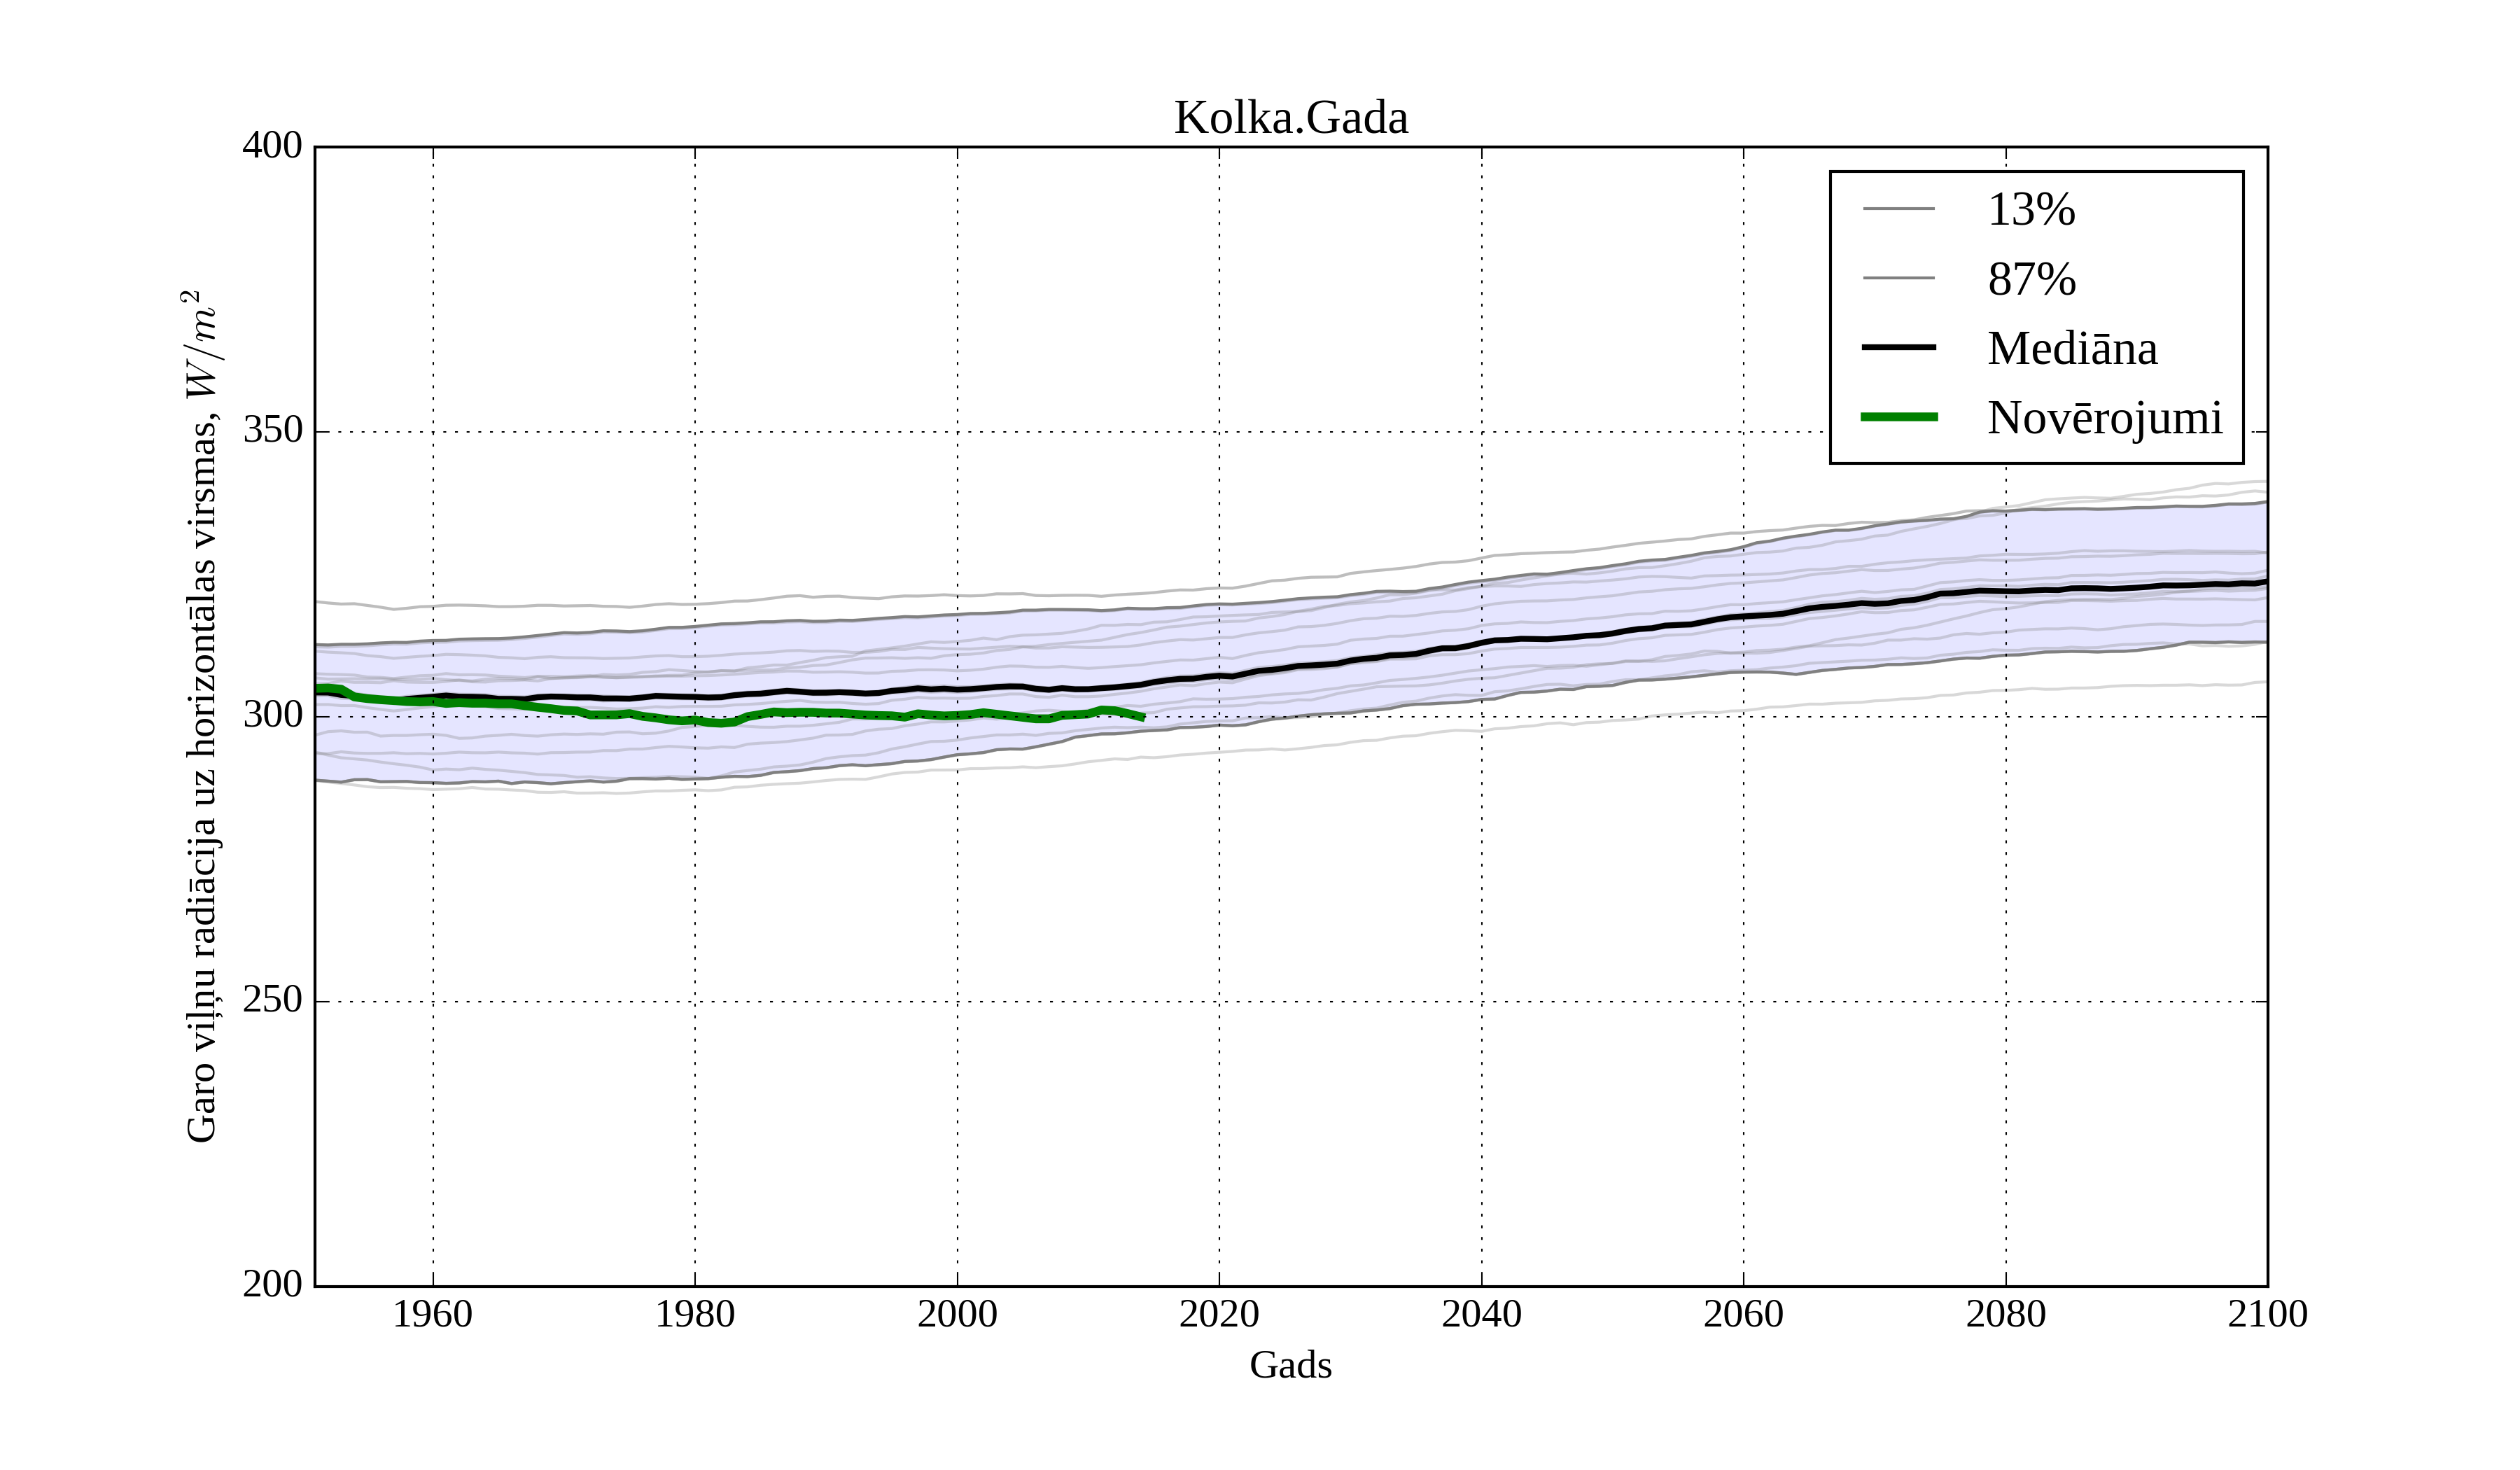
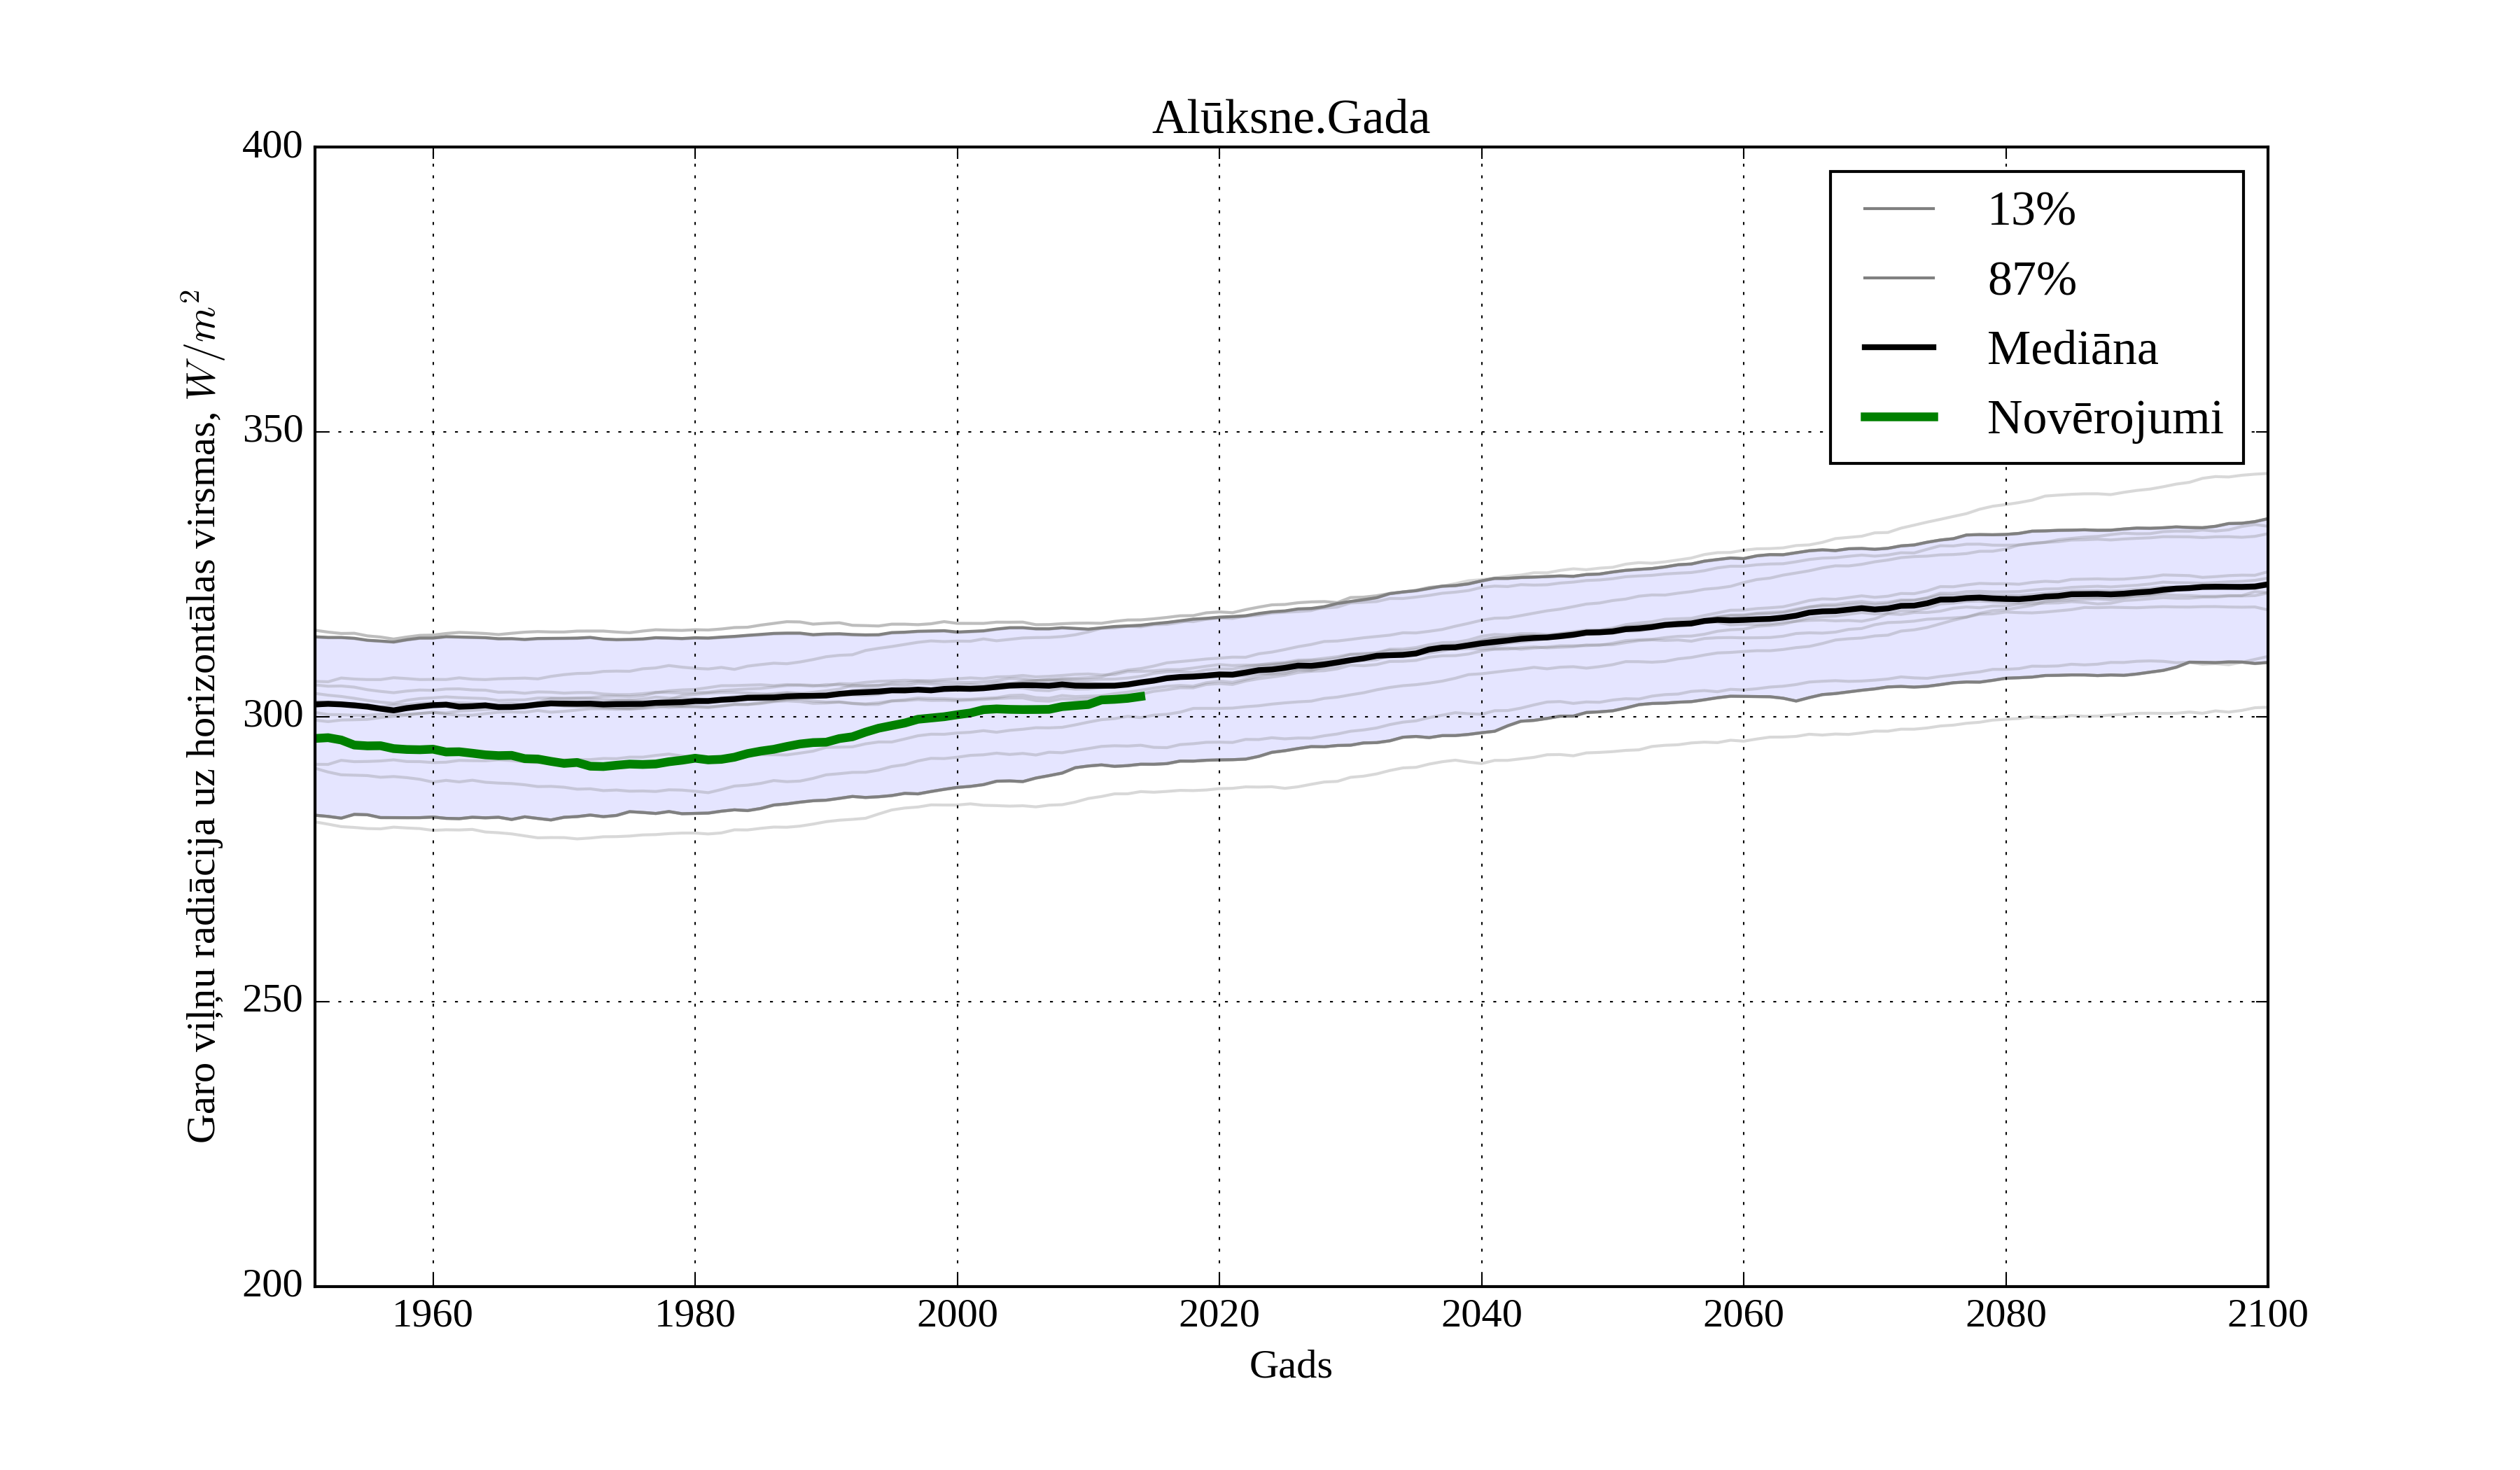
There is light tendency for solar irradiation to decrease according to median of RCM models, see Figures 7-10.
Figure 7. Climatological trend of yearly average solar irradiation on horizontal surface in Kolka
Figure 8. Climatological trend of yearly average solar irradiation on horizontal surface in Aluksne
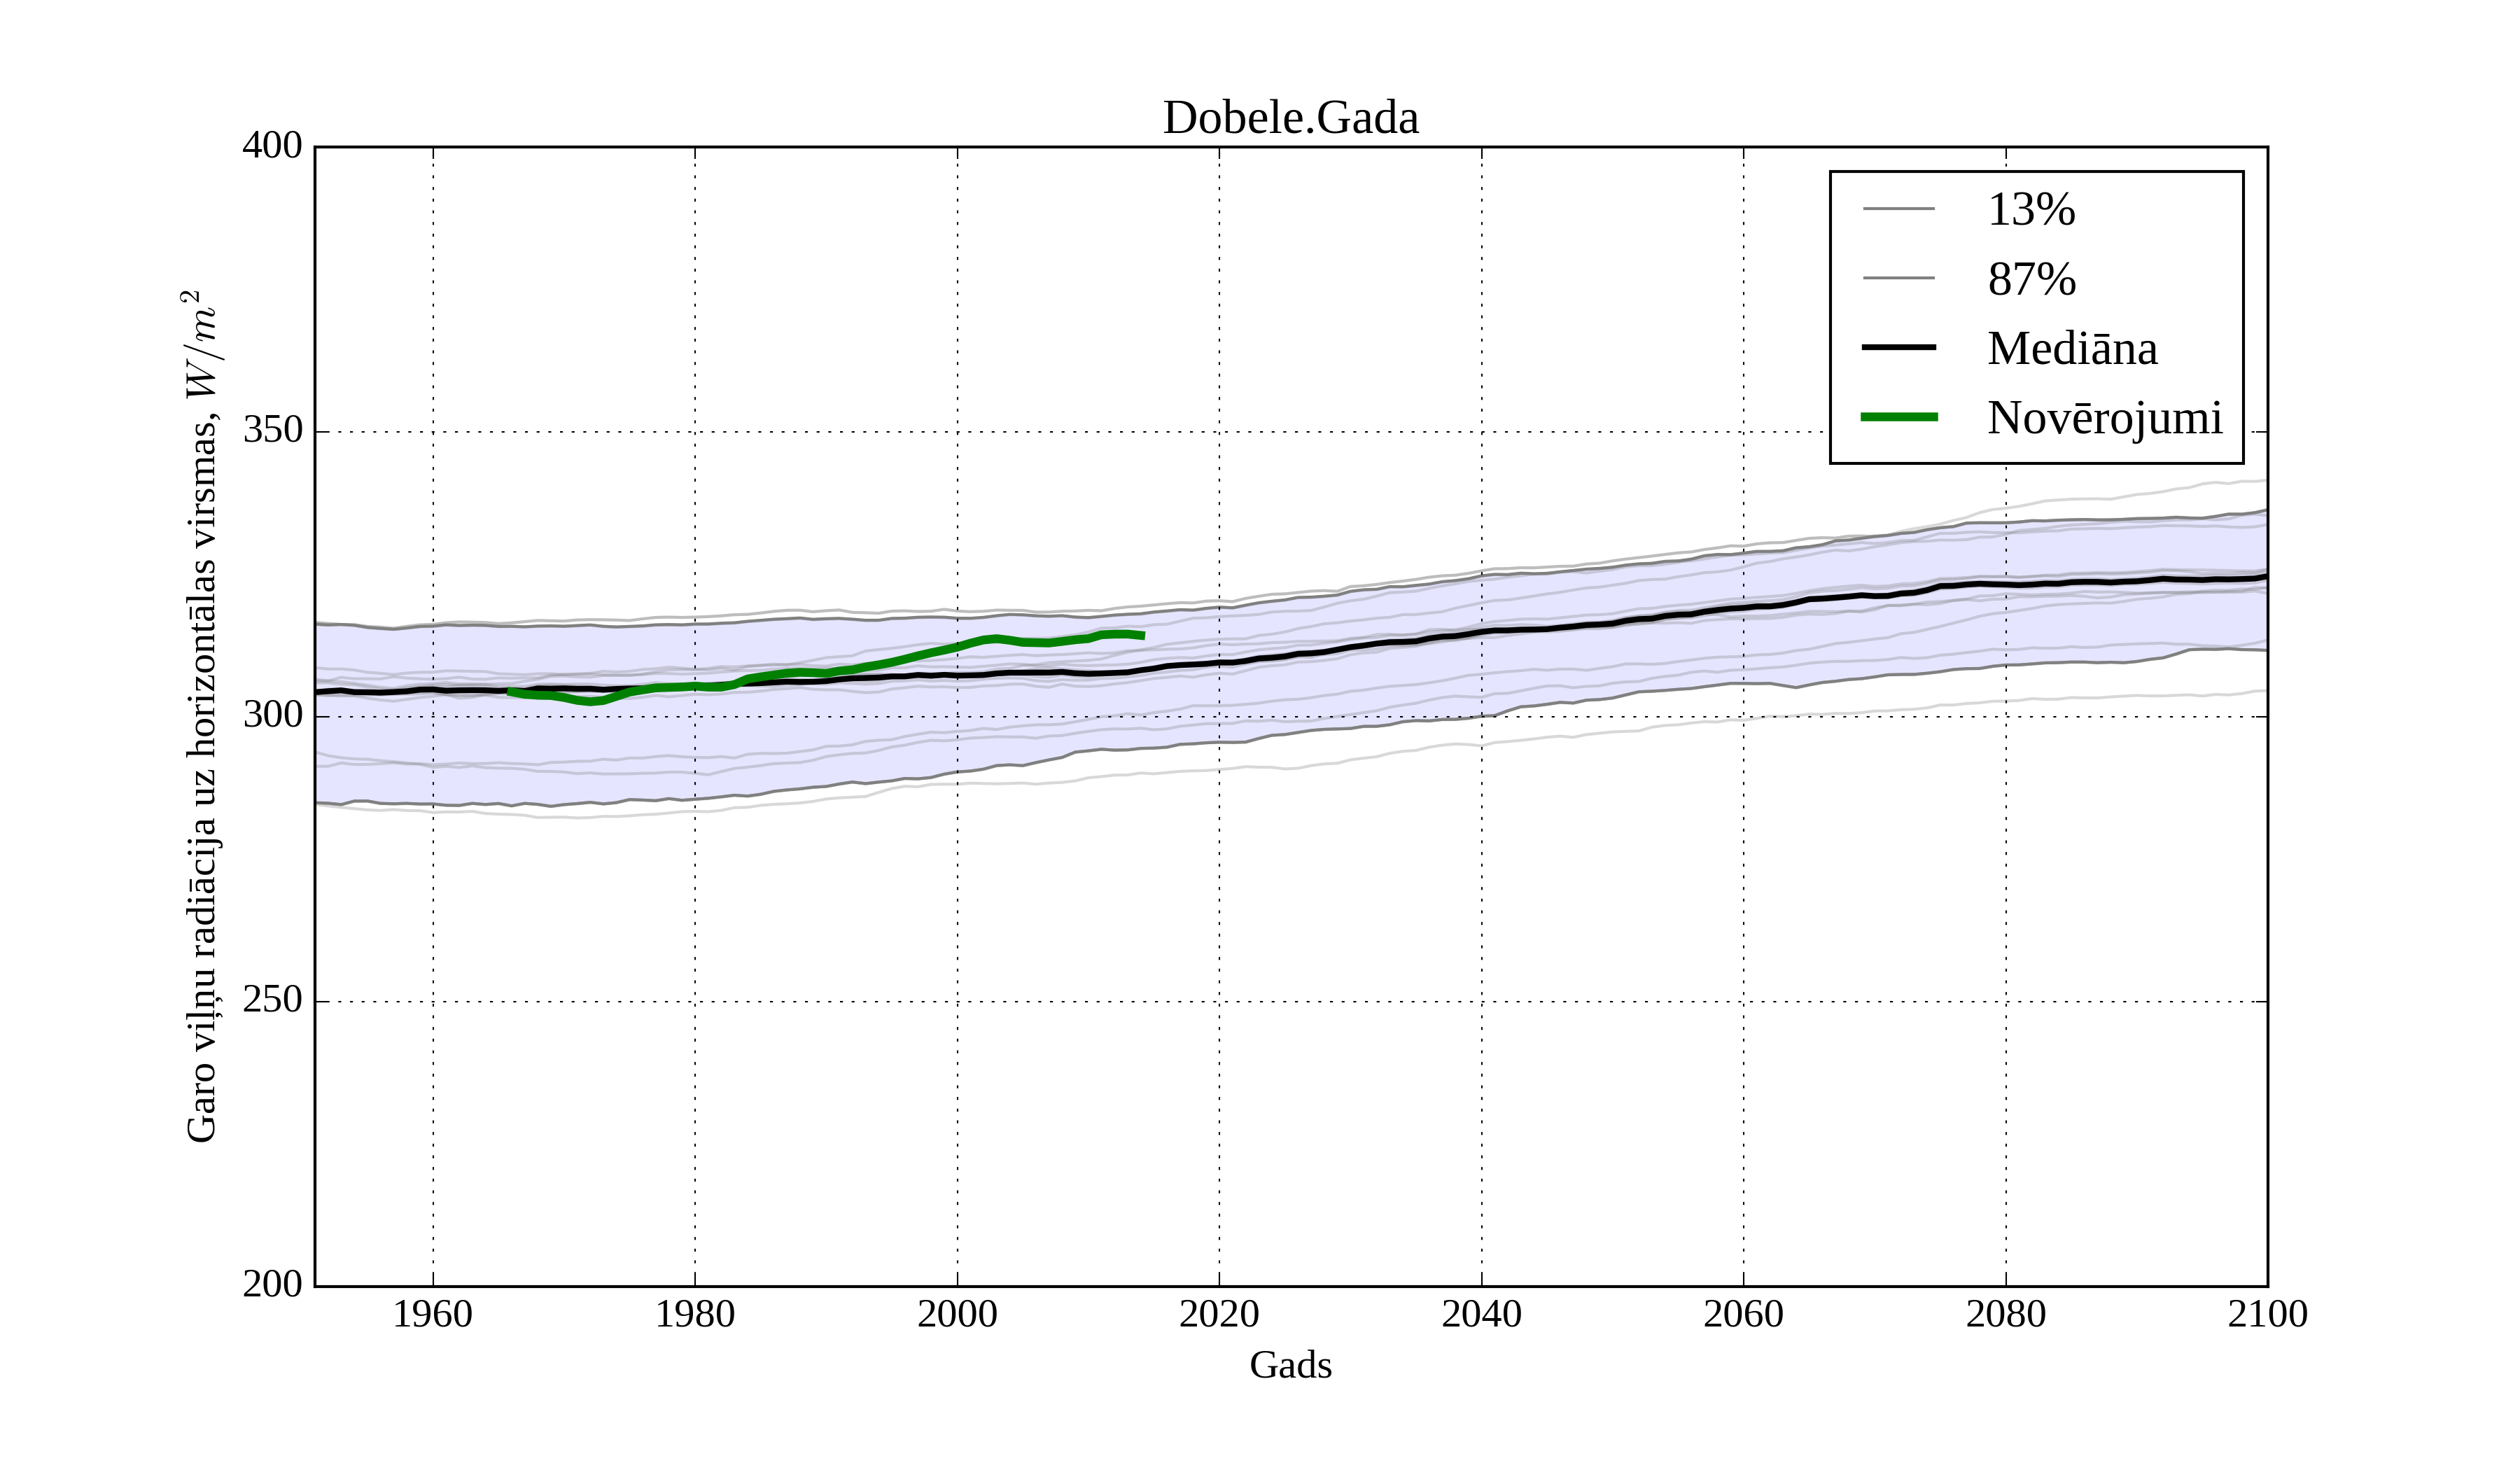
Figure 9. Climatological trend of yearly average solar irradiation on horizontal surface in Dobele
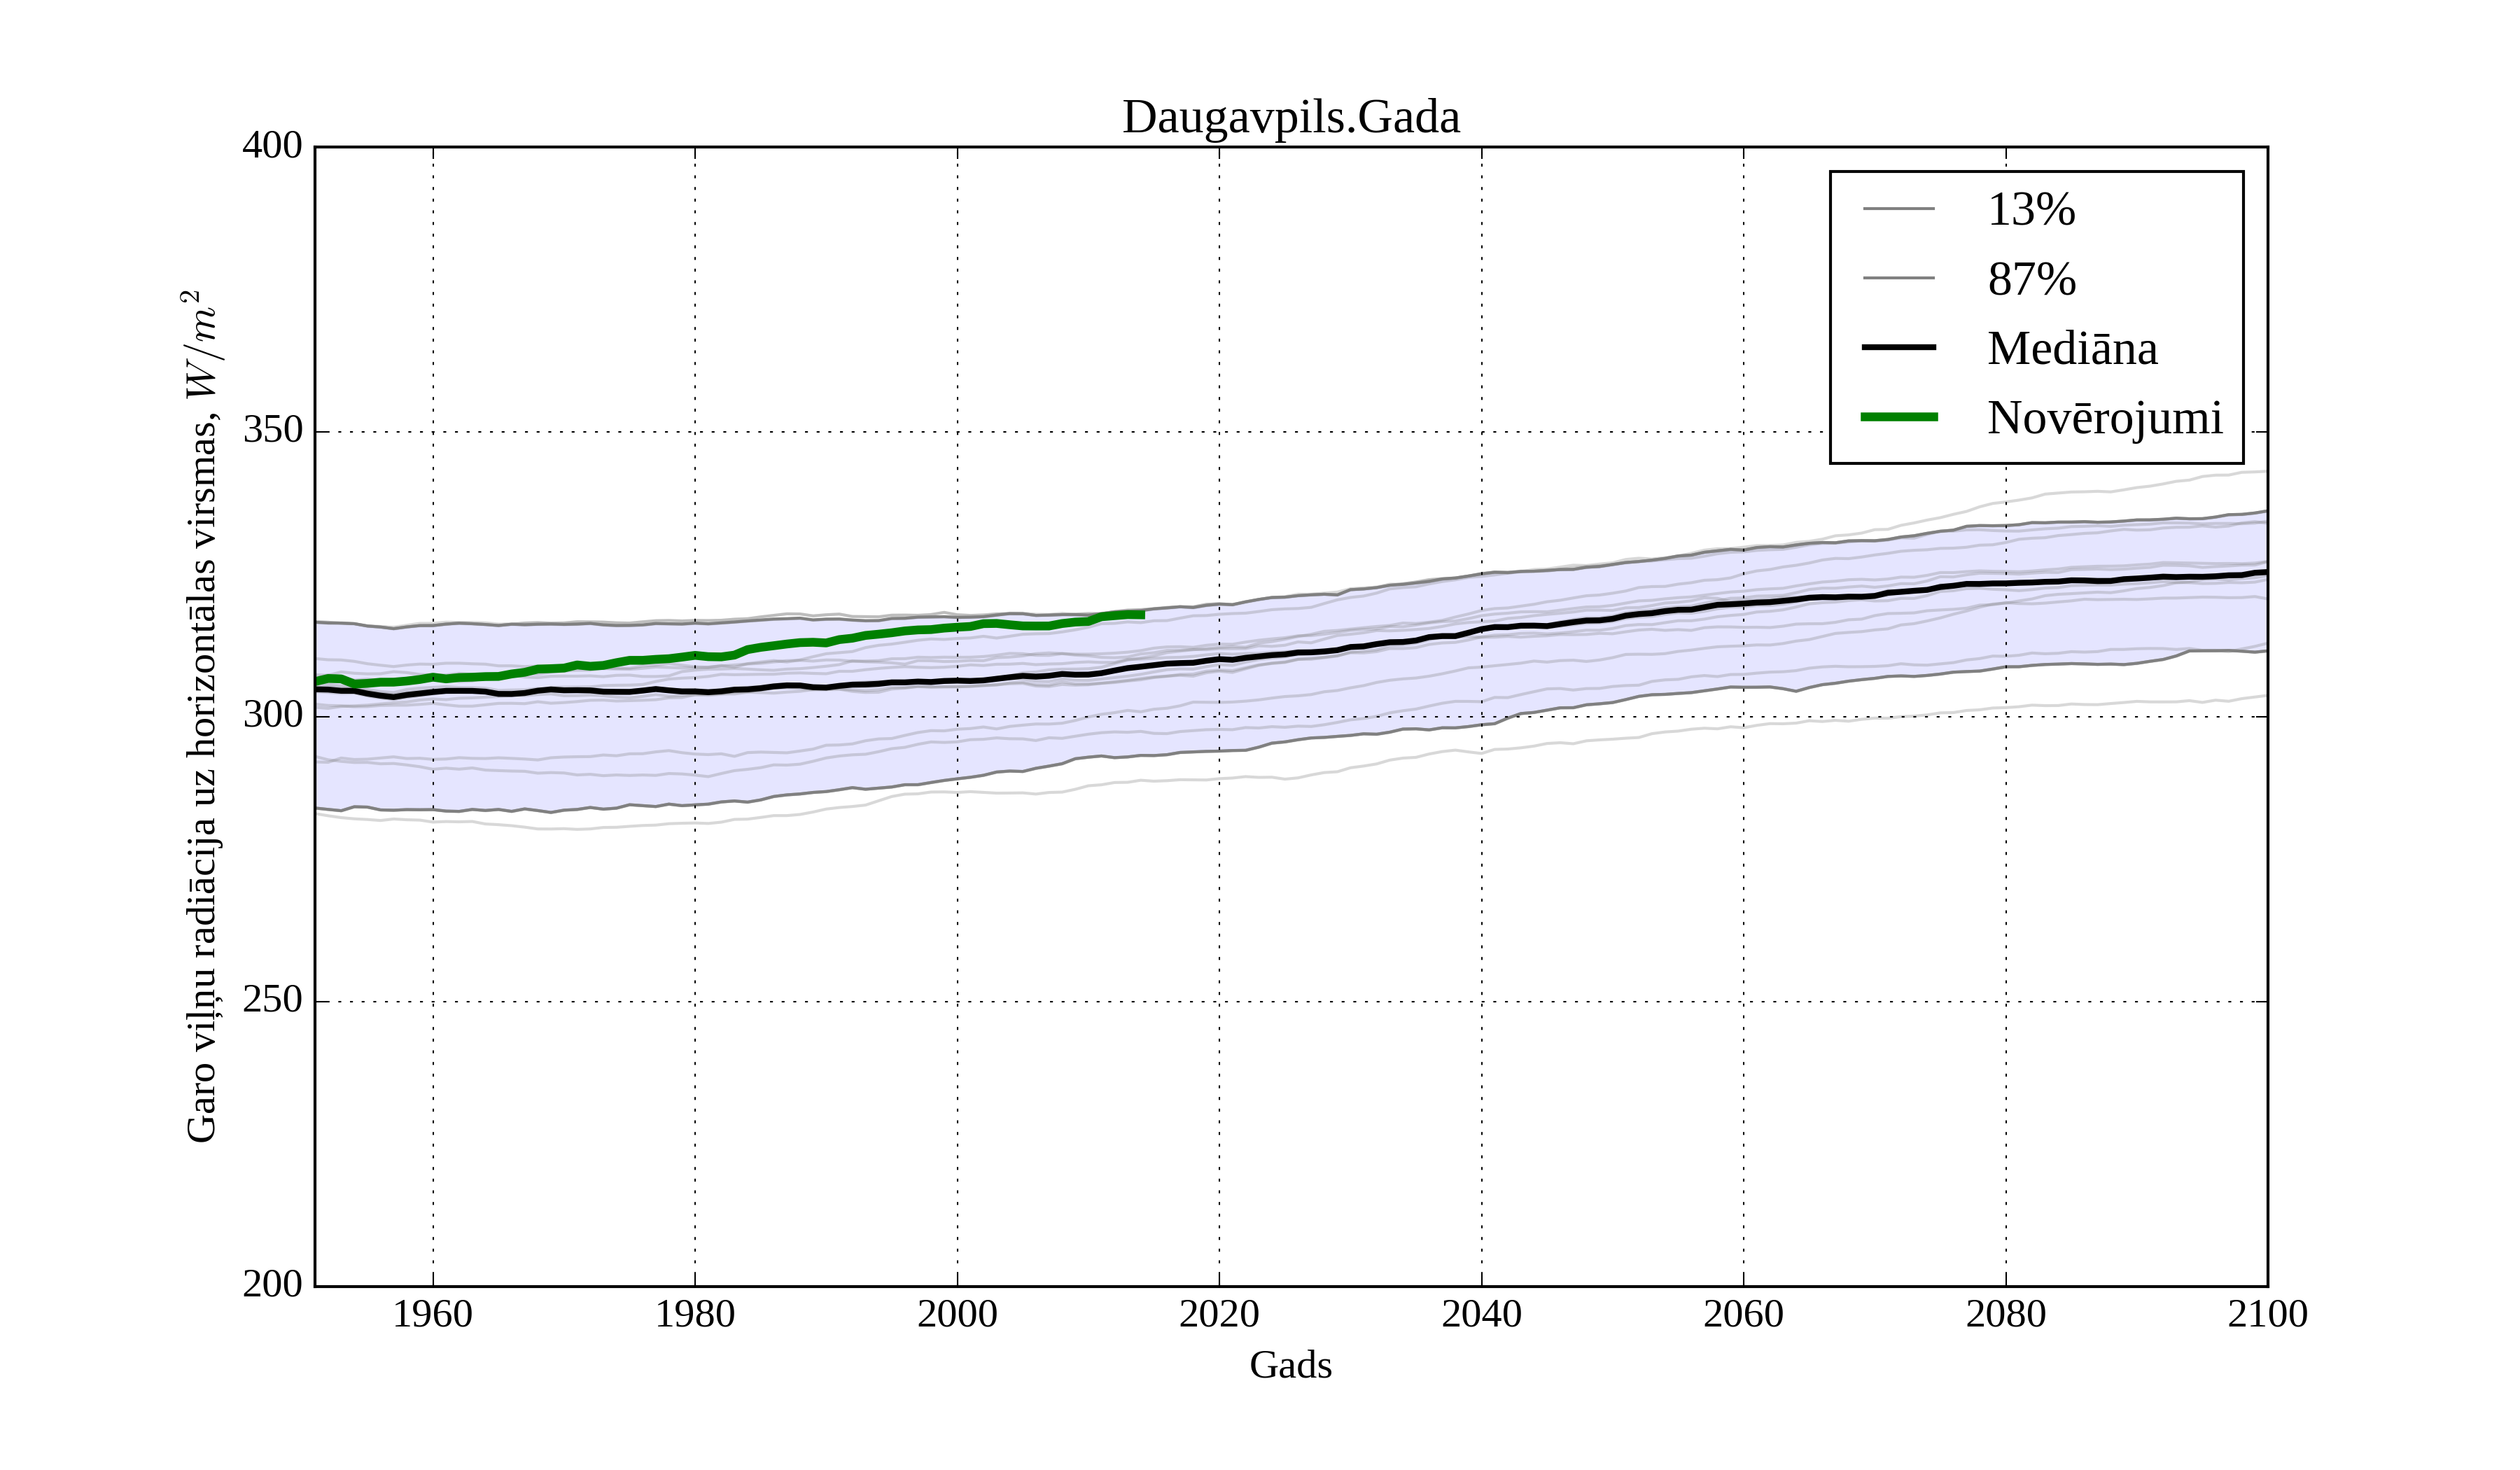
Figure 10. Climatological trend of yearly average solar irradiation on horizontal surface in Daugavpils
The trend of subjective derived observations could be anything.
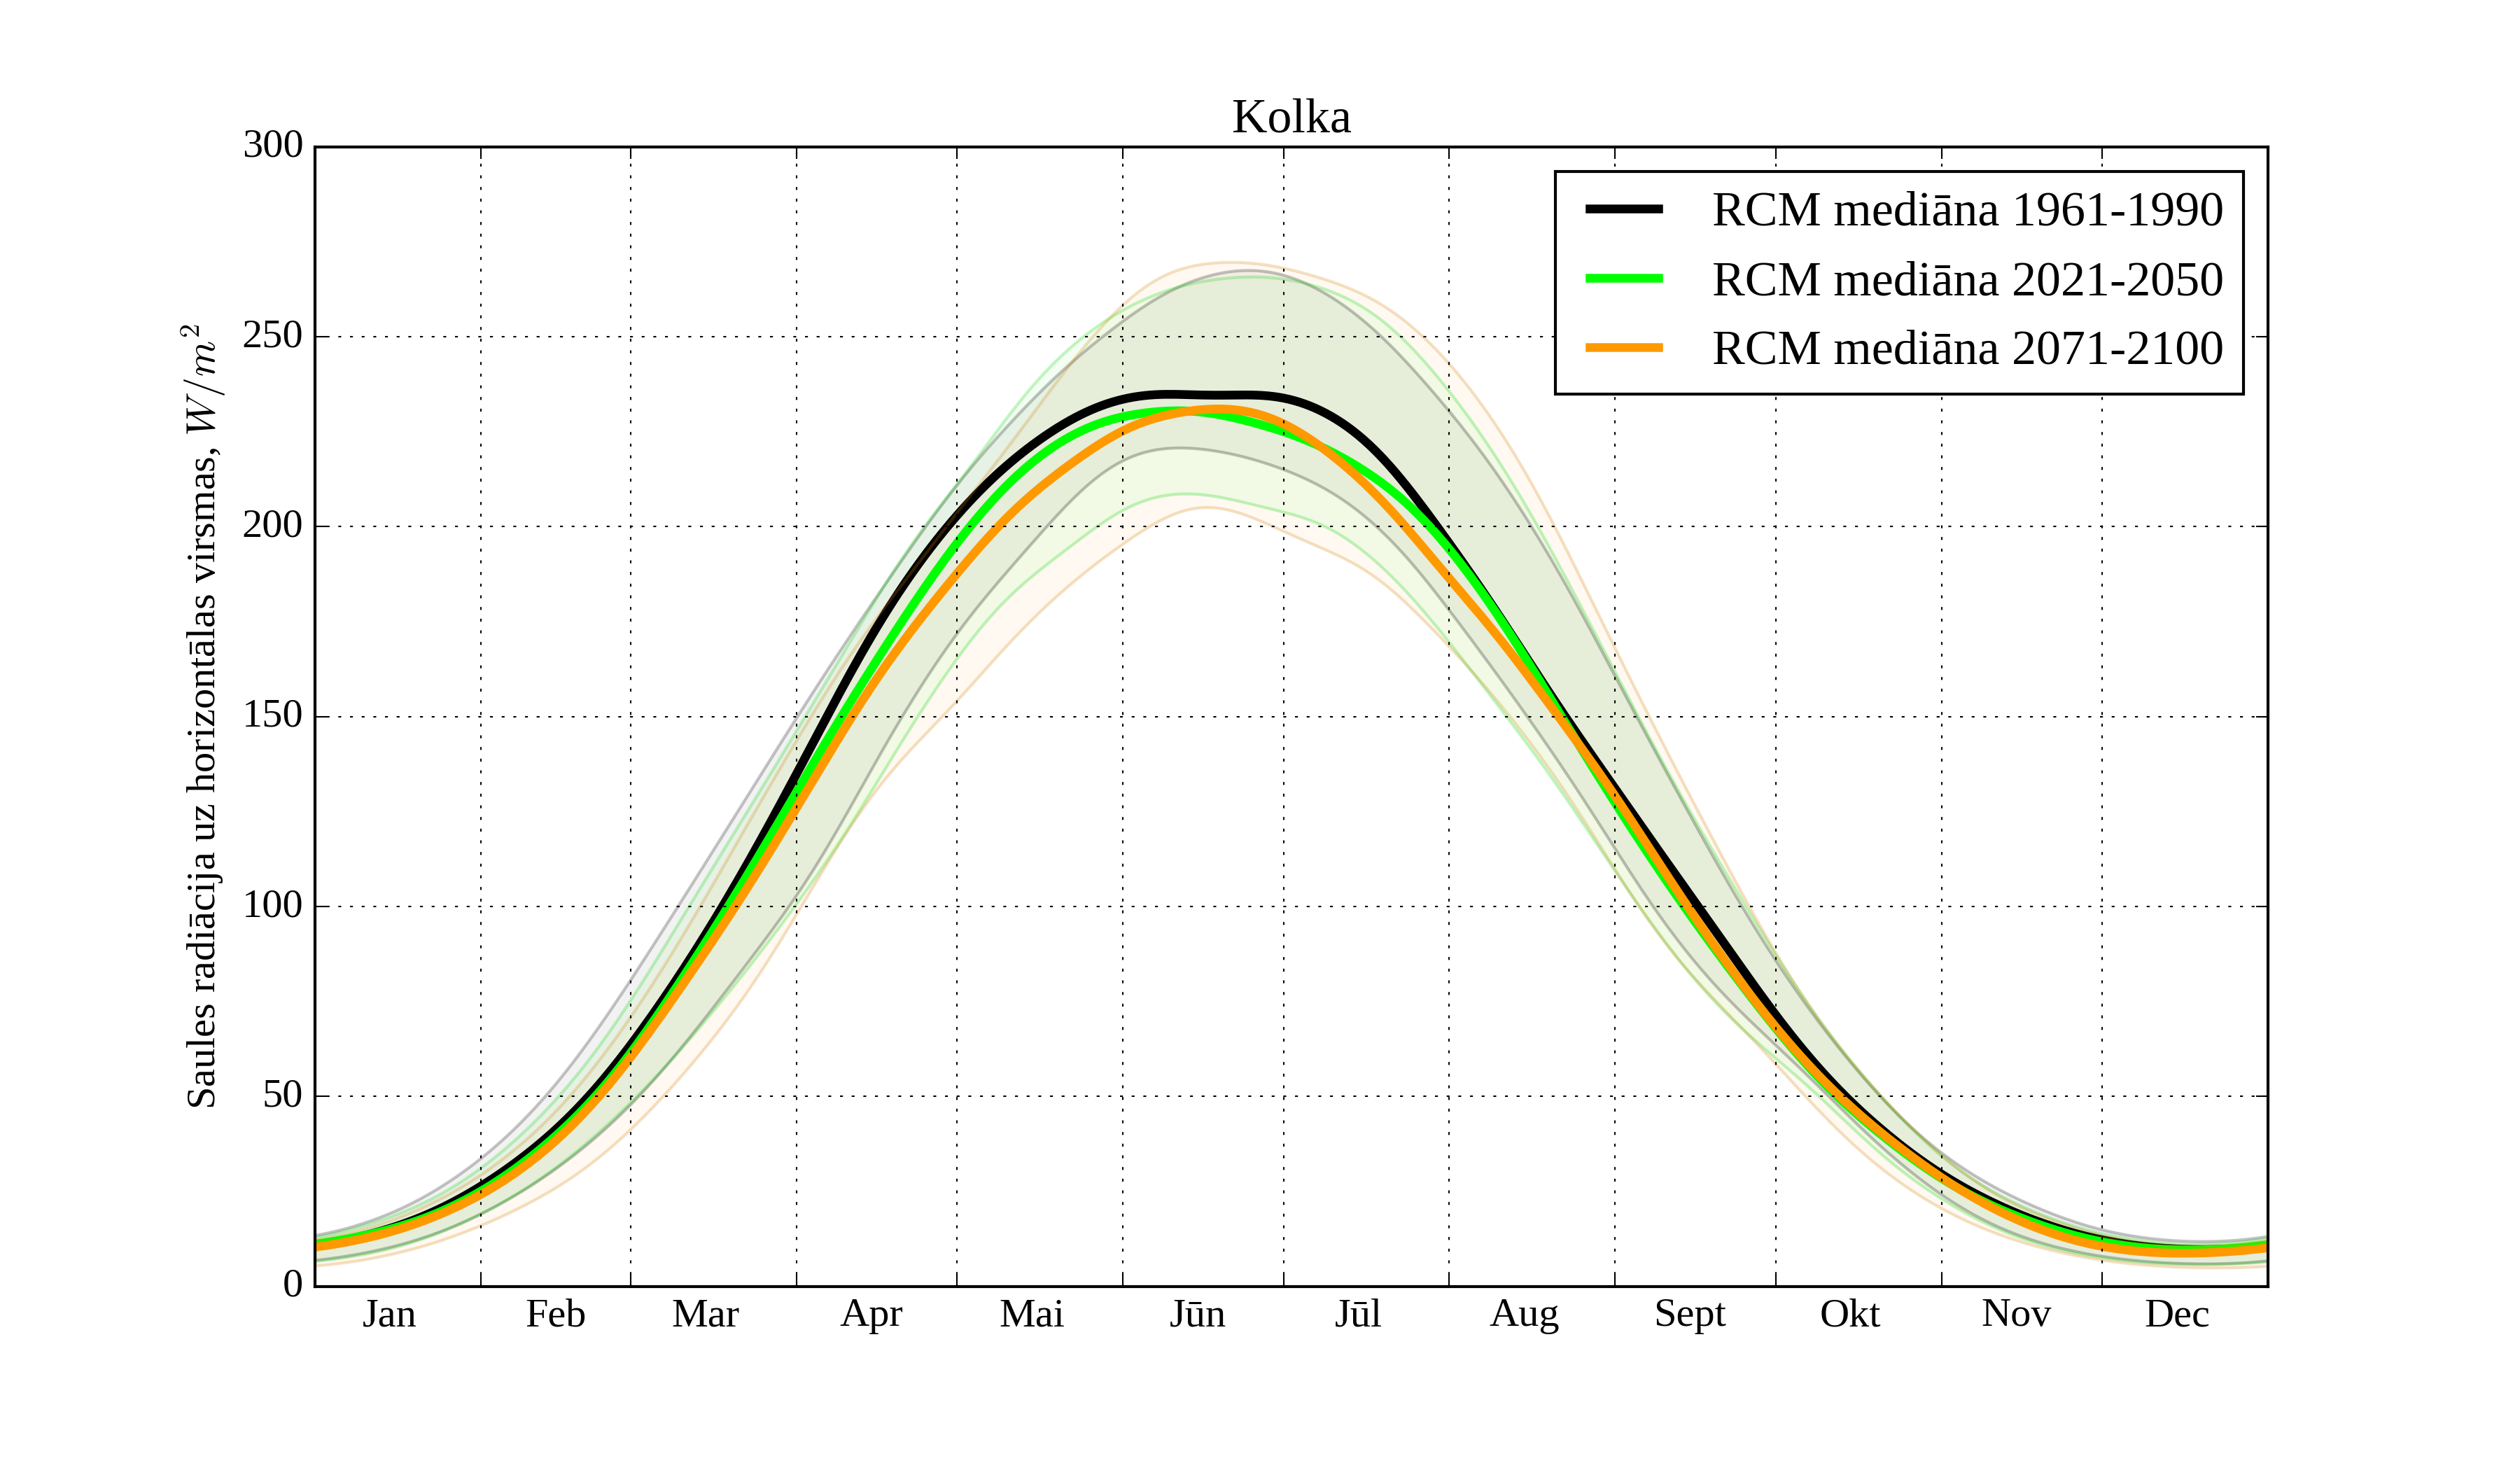
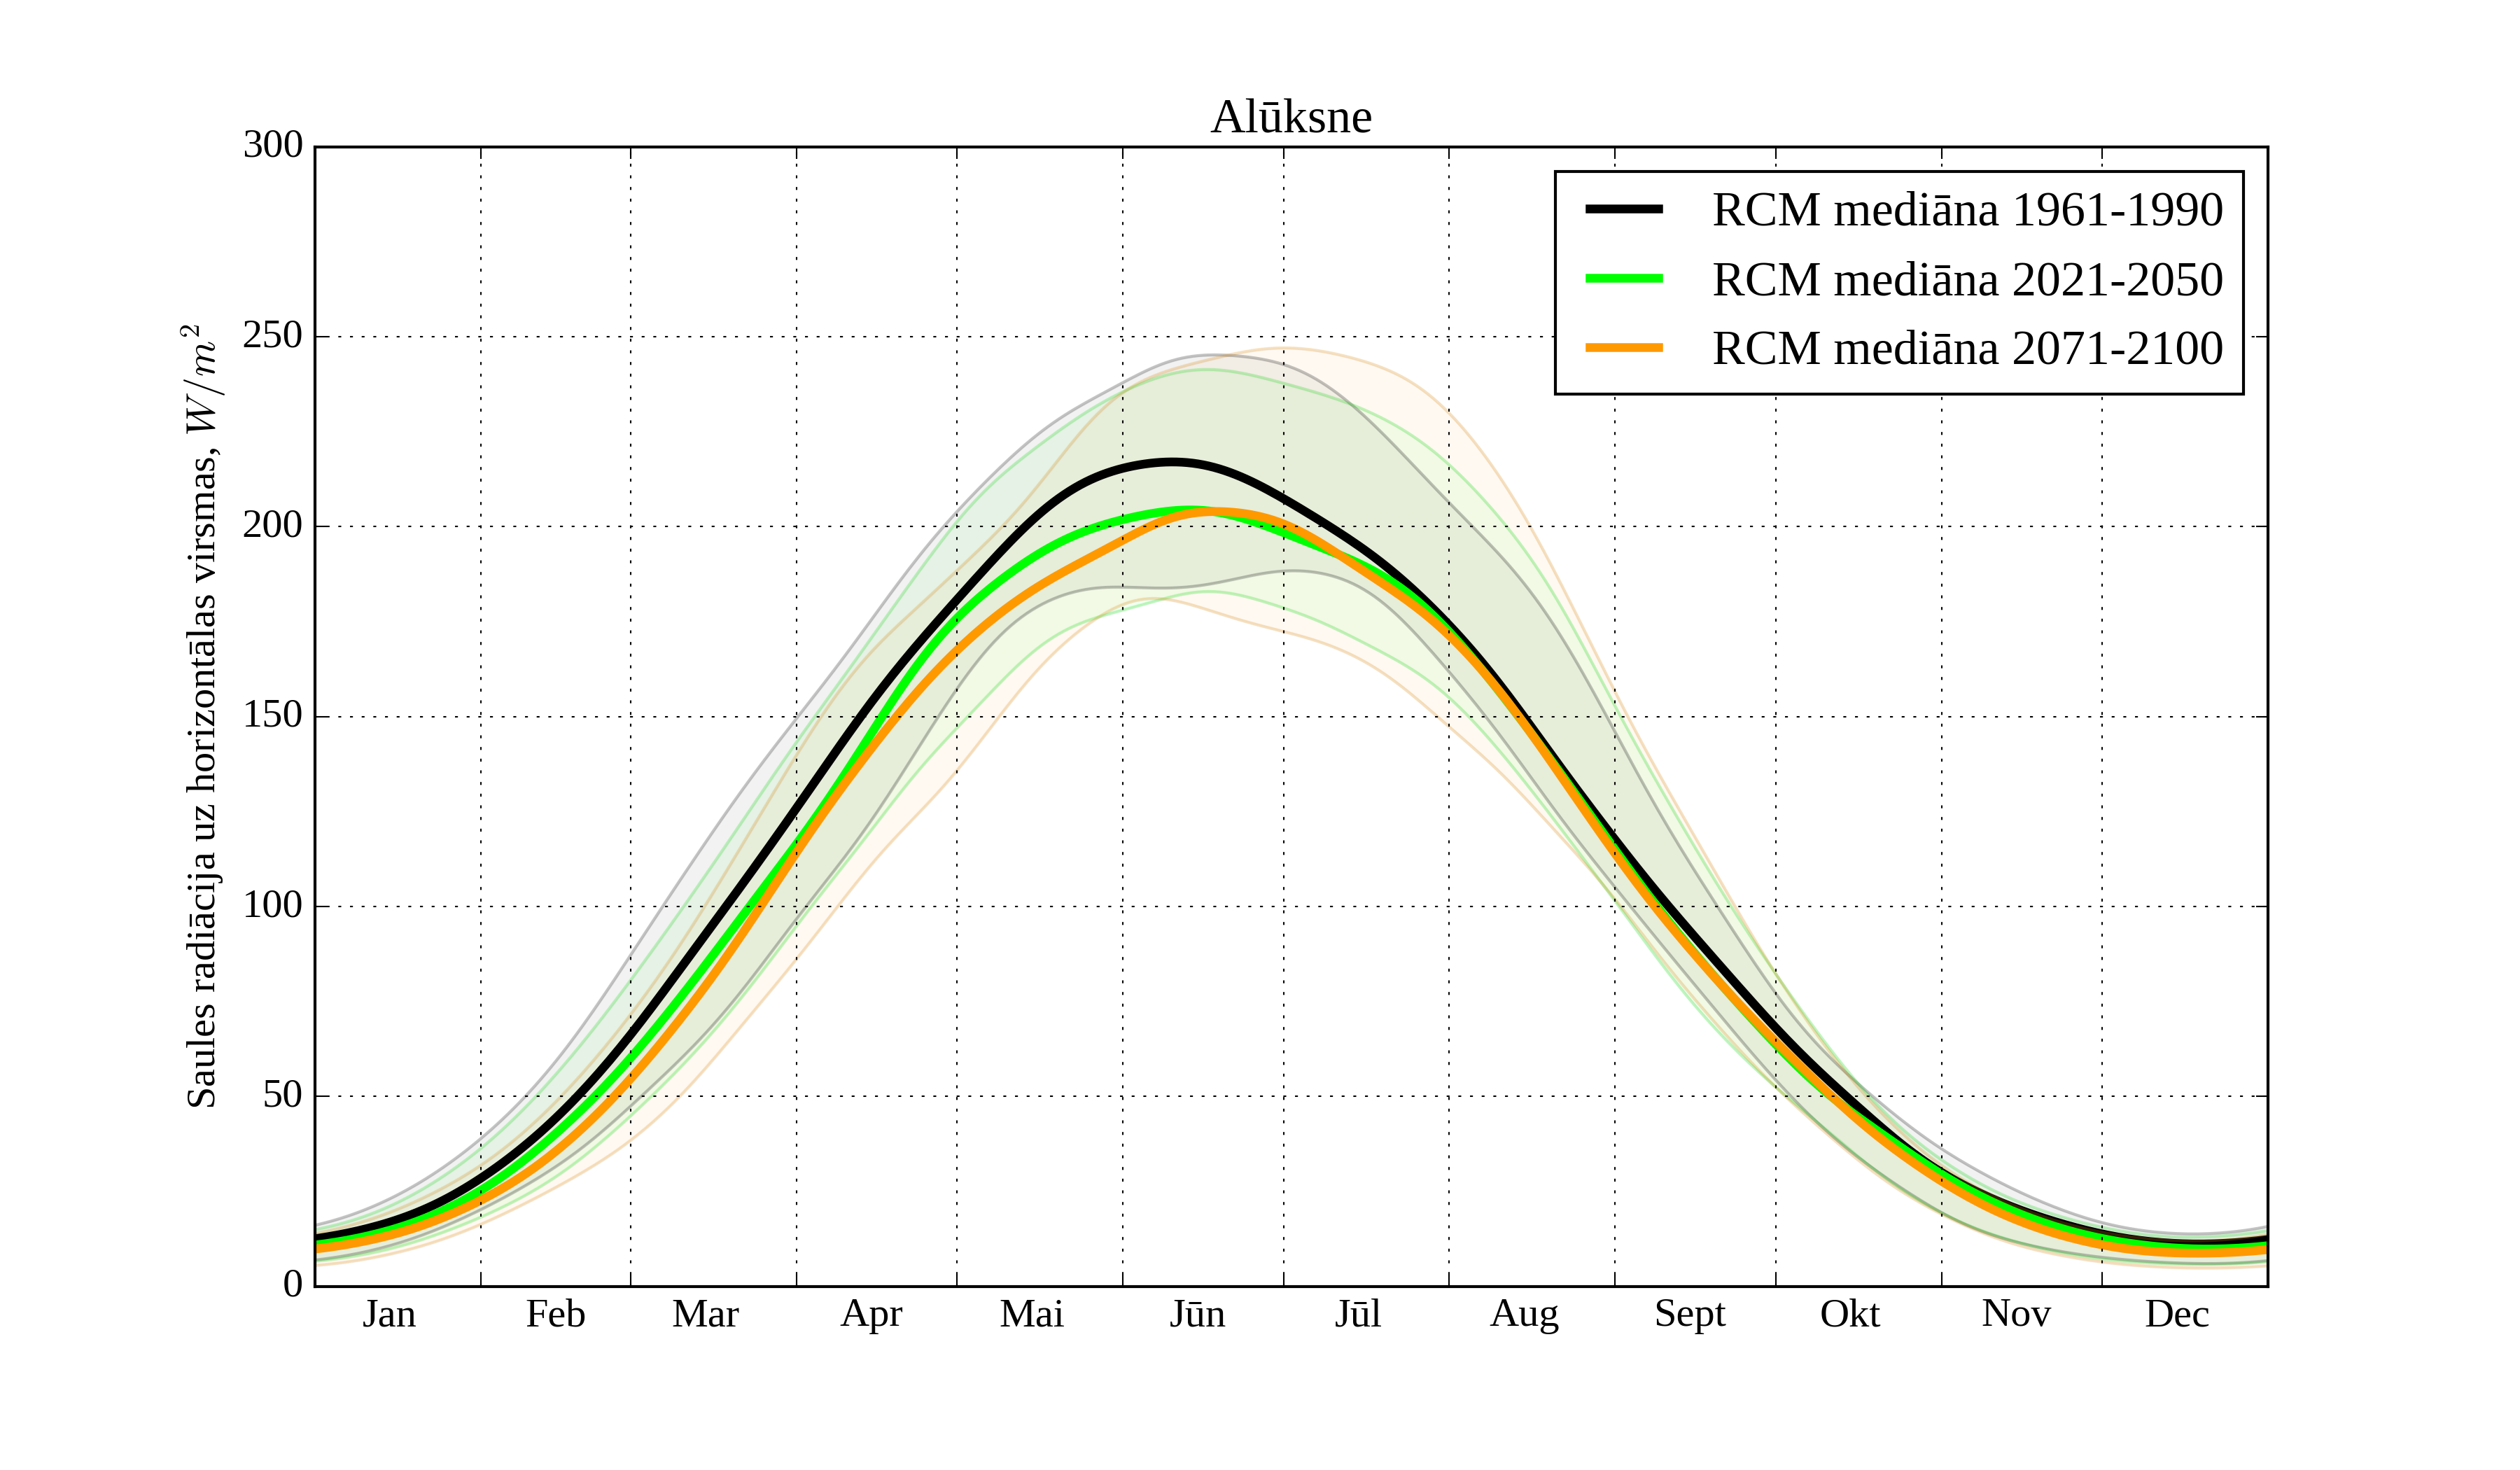
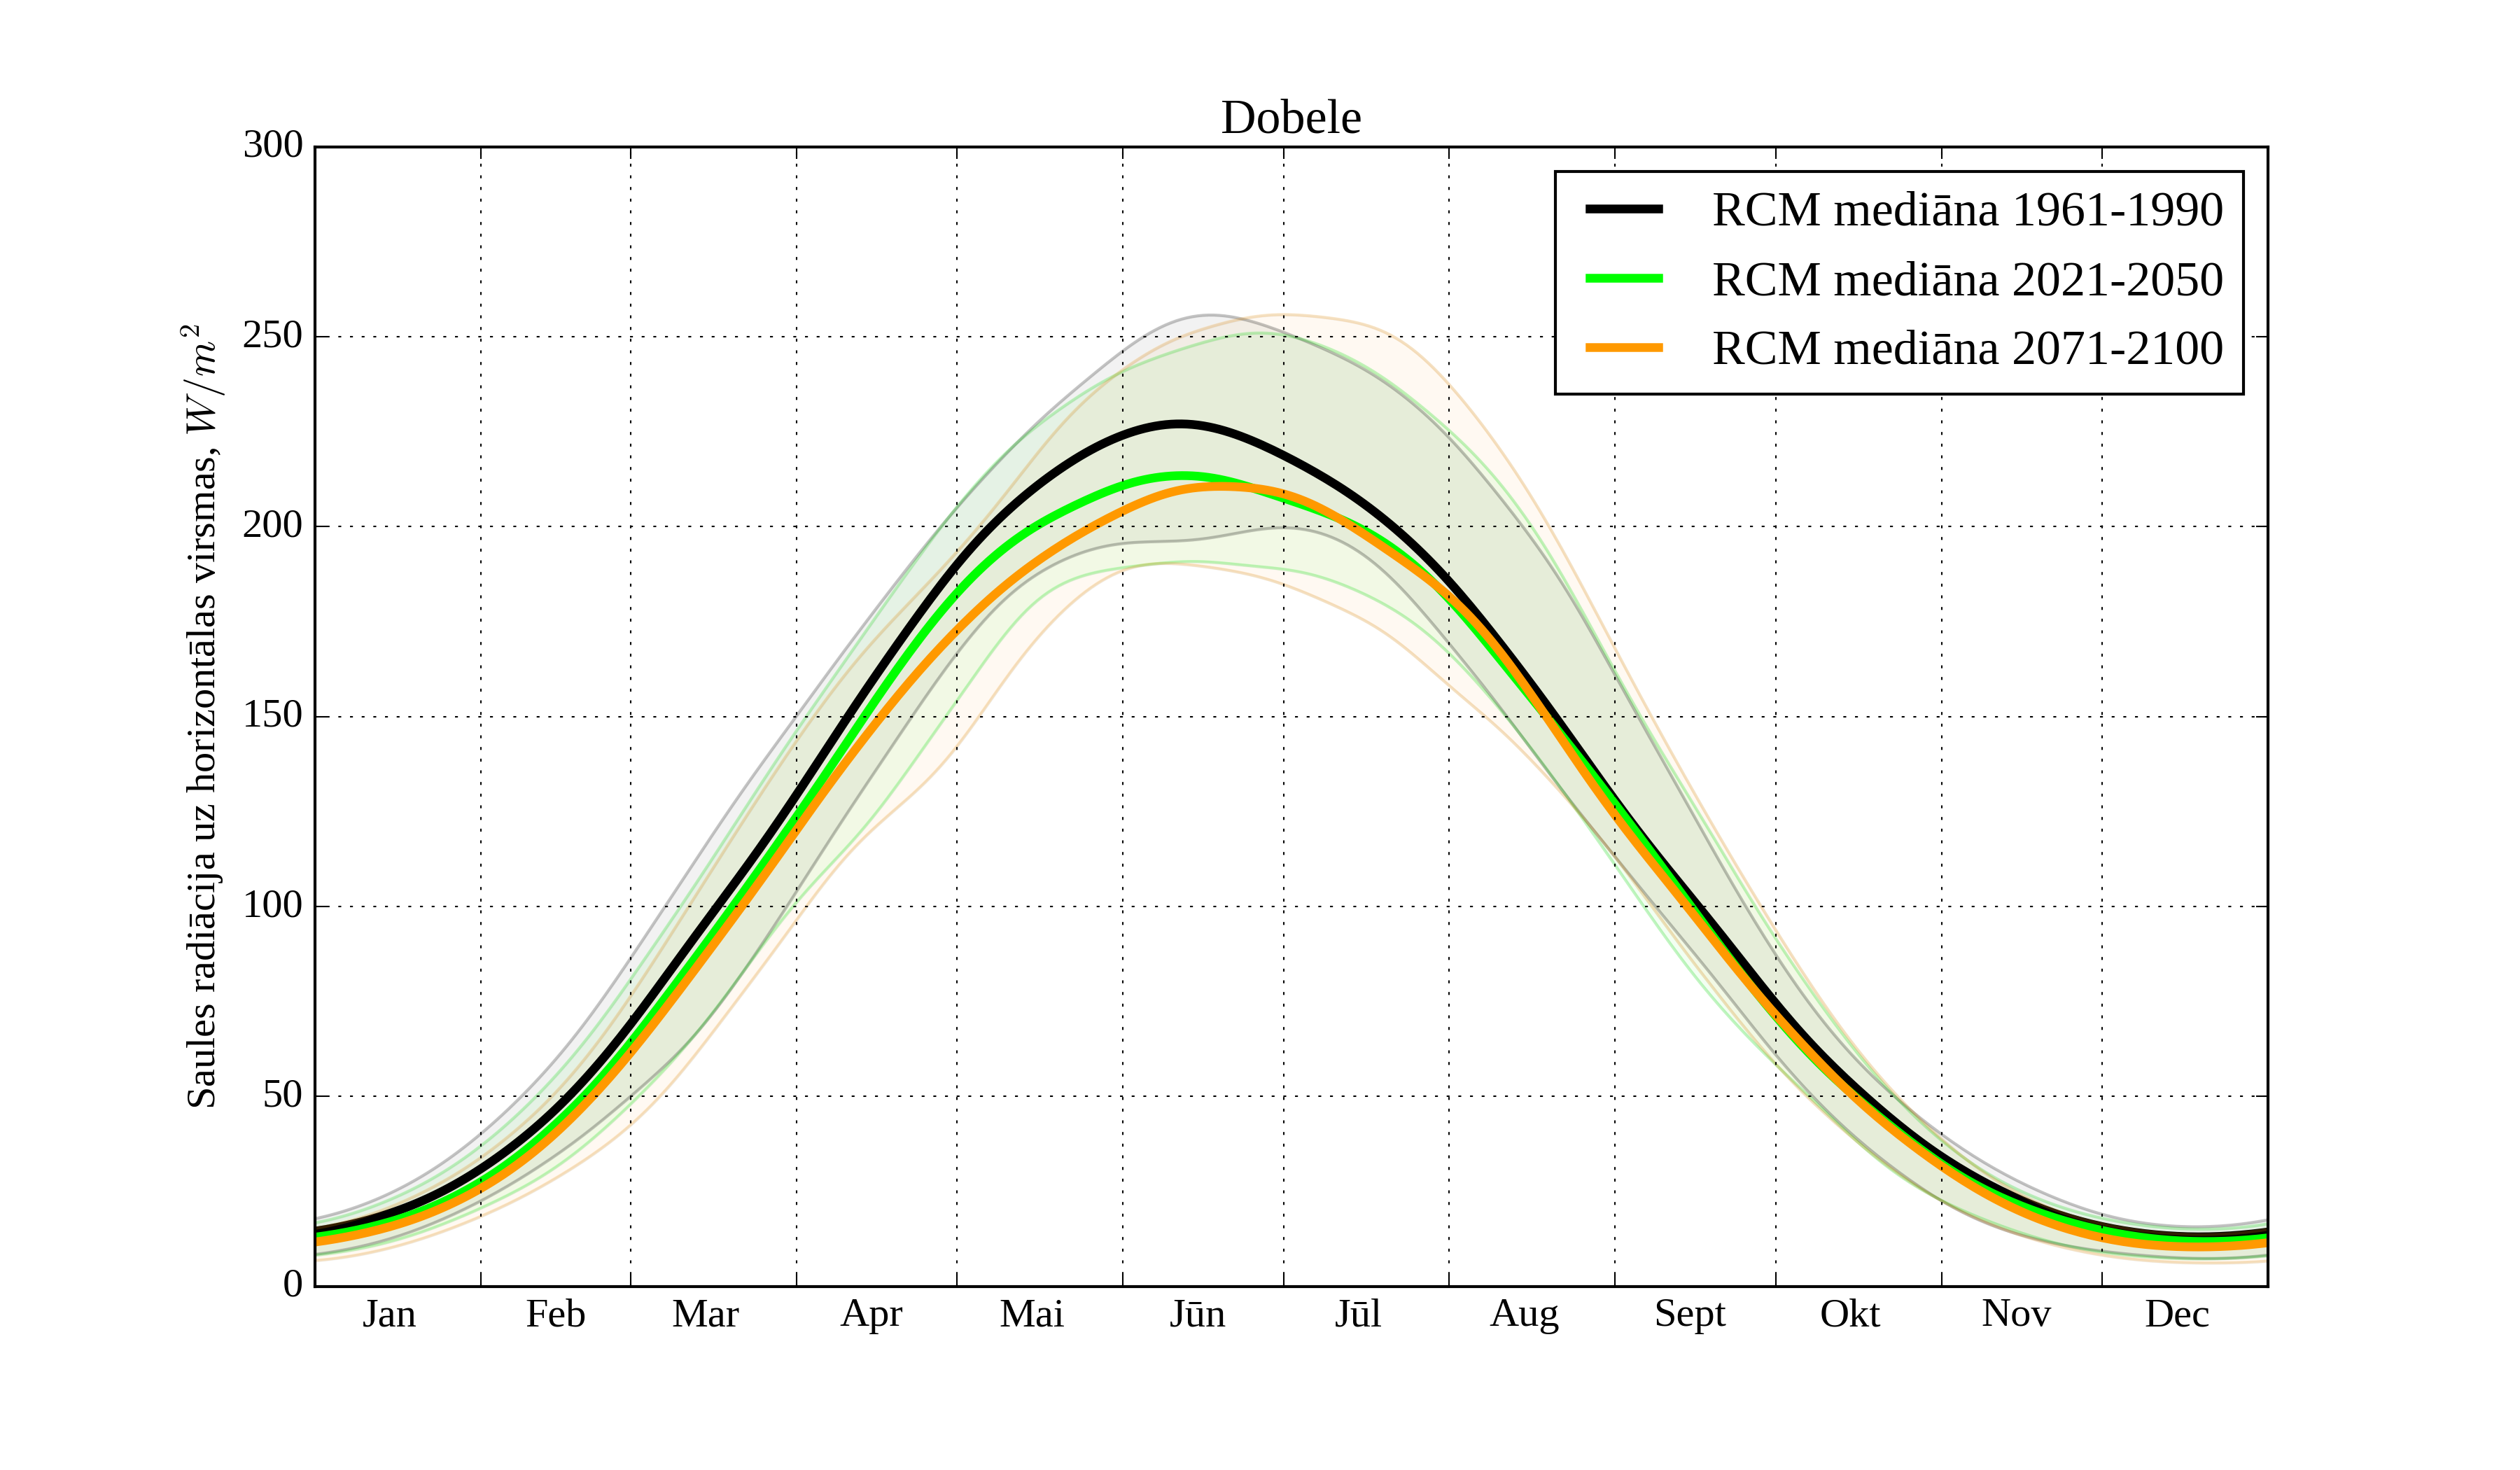
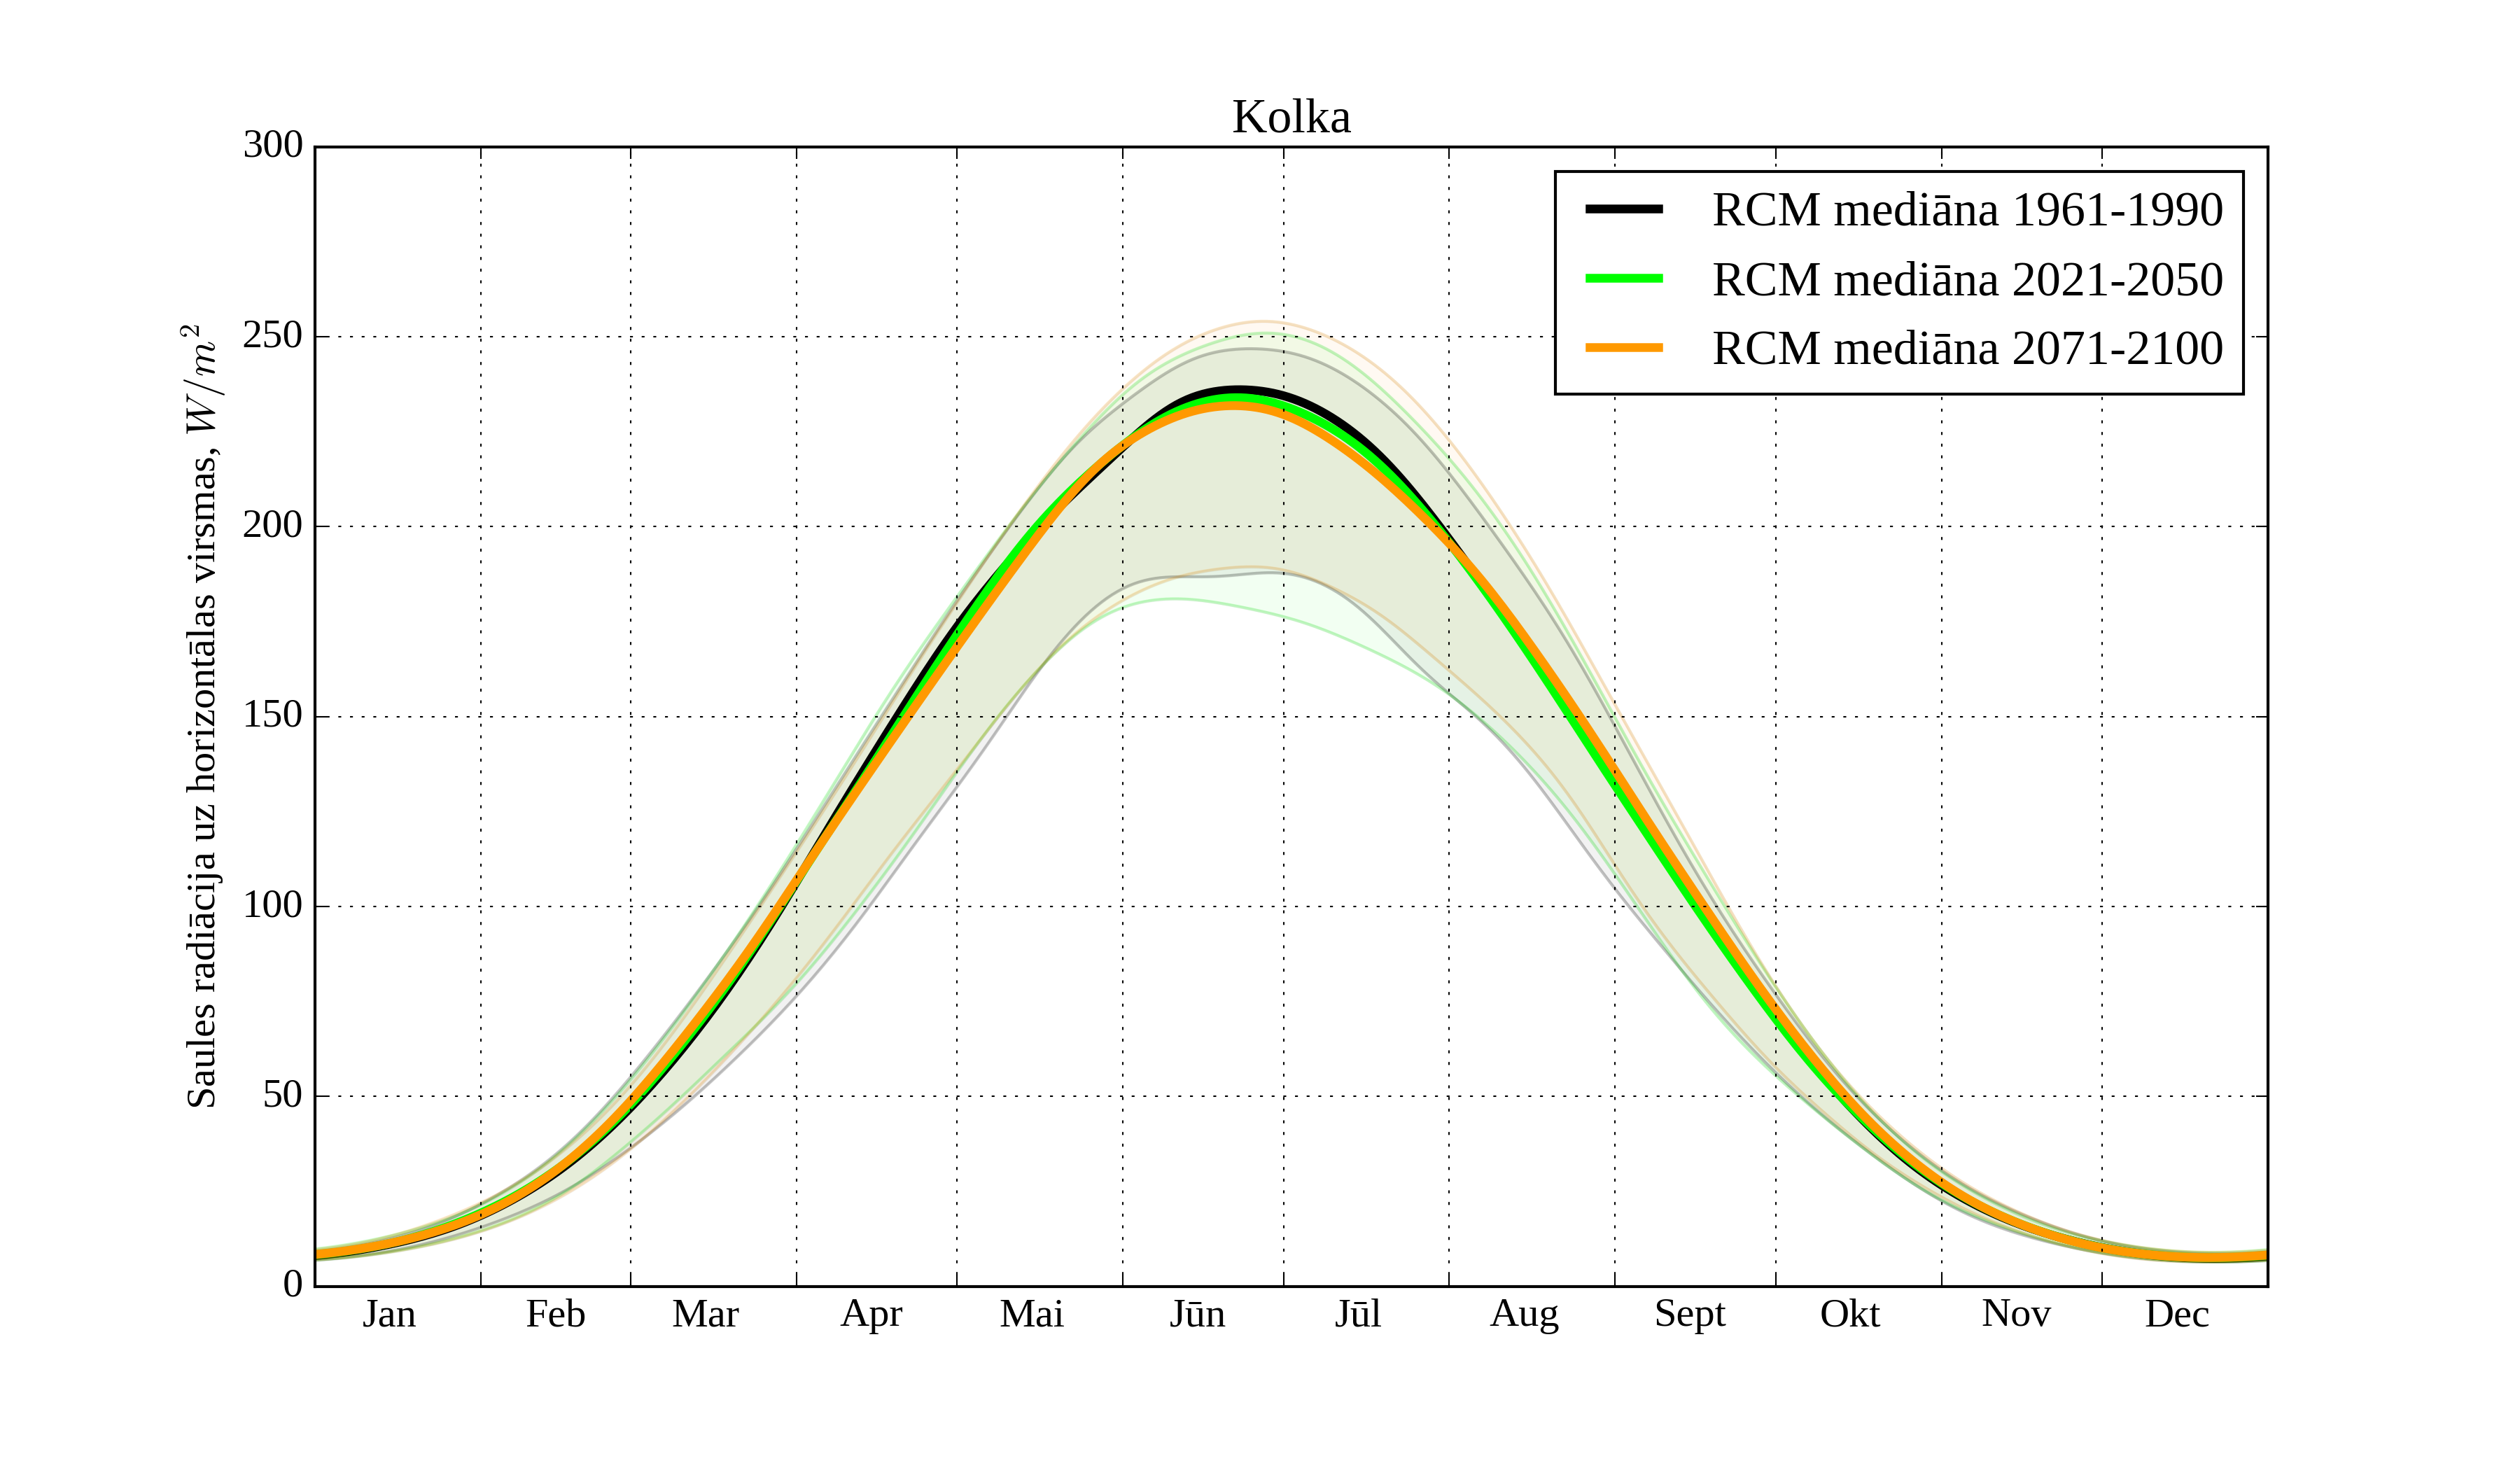
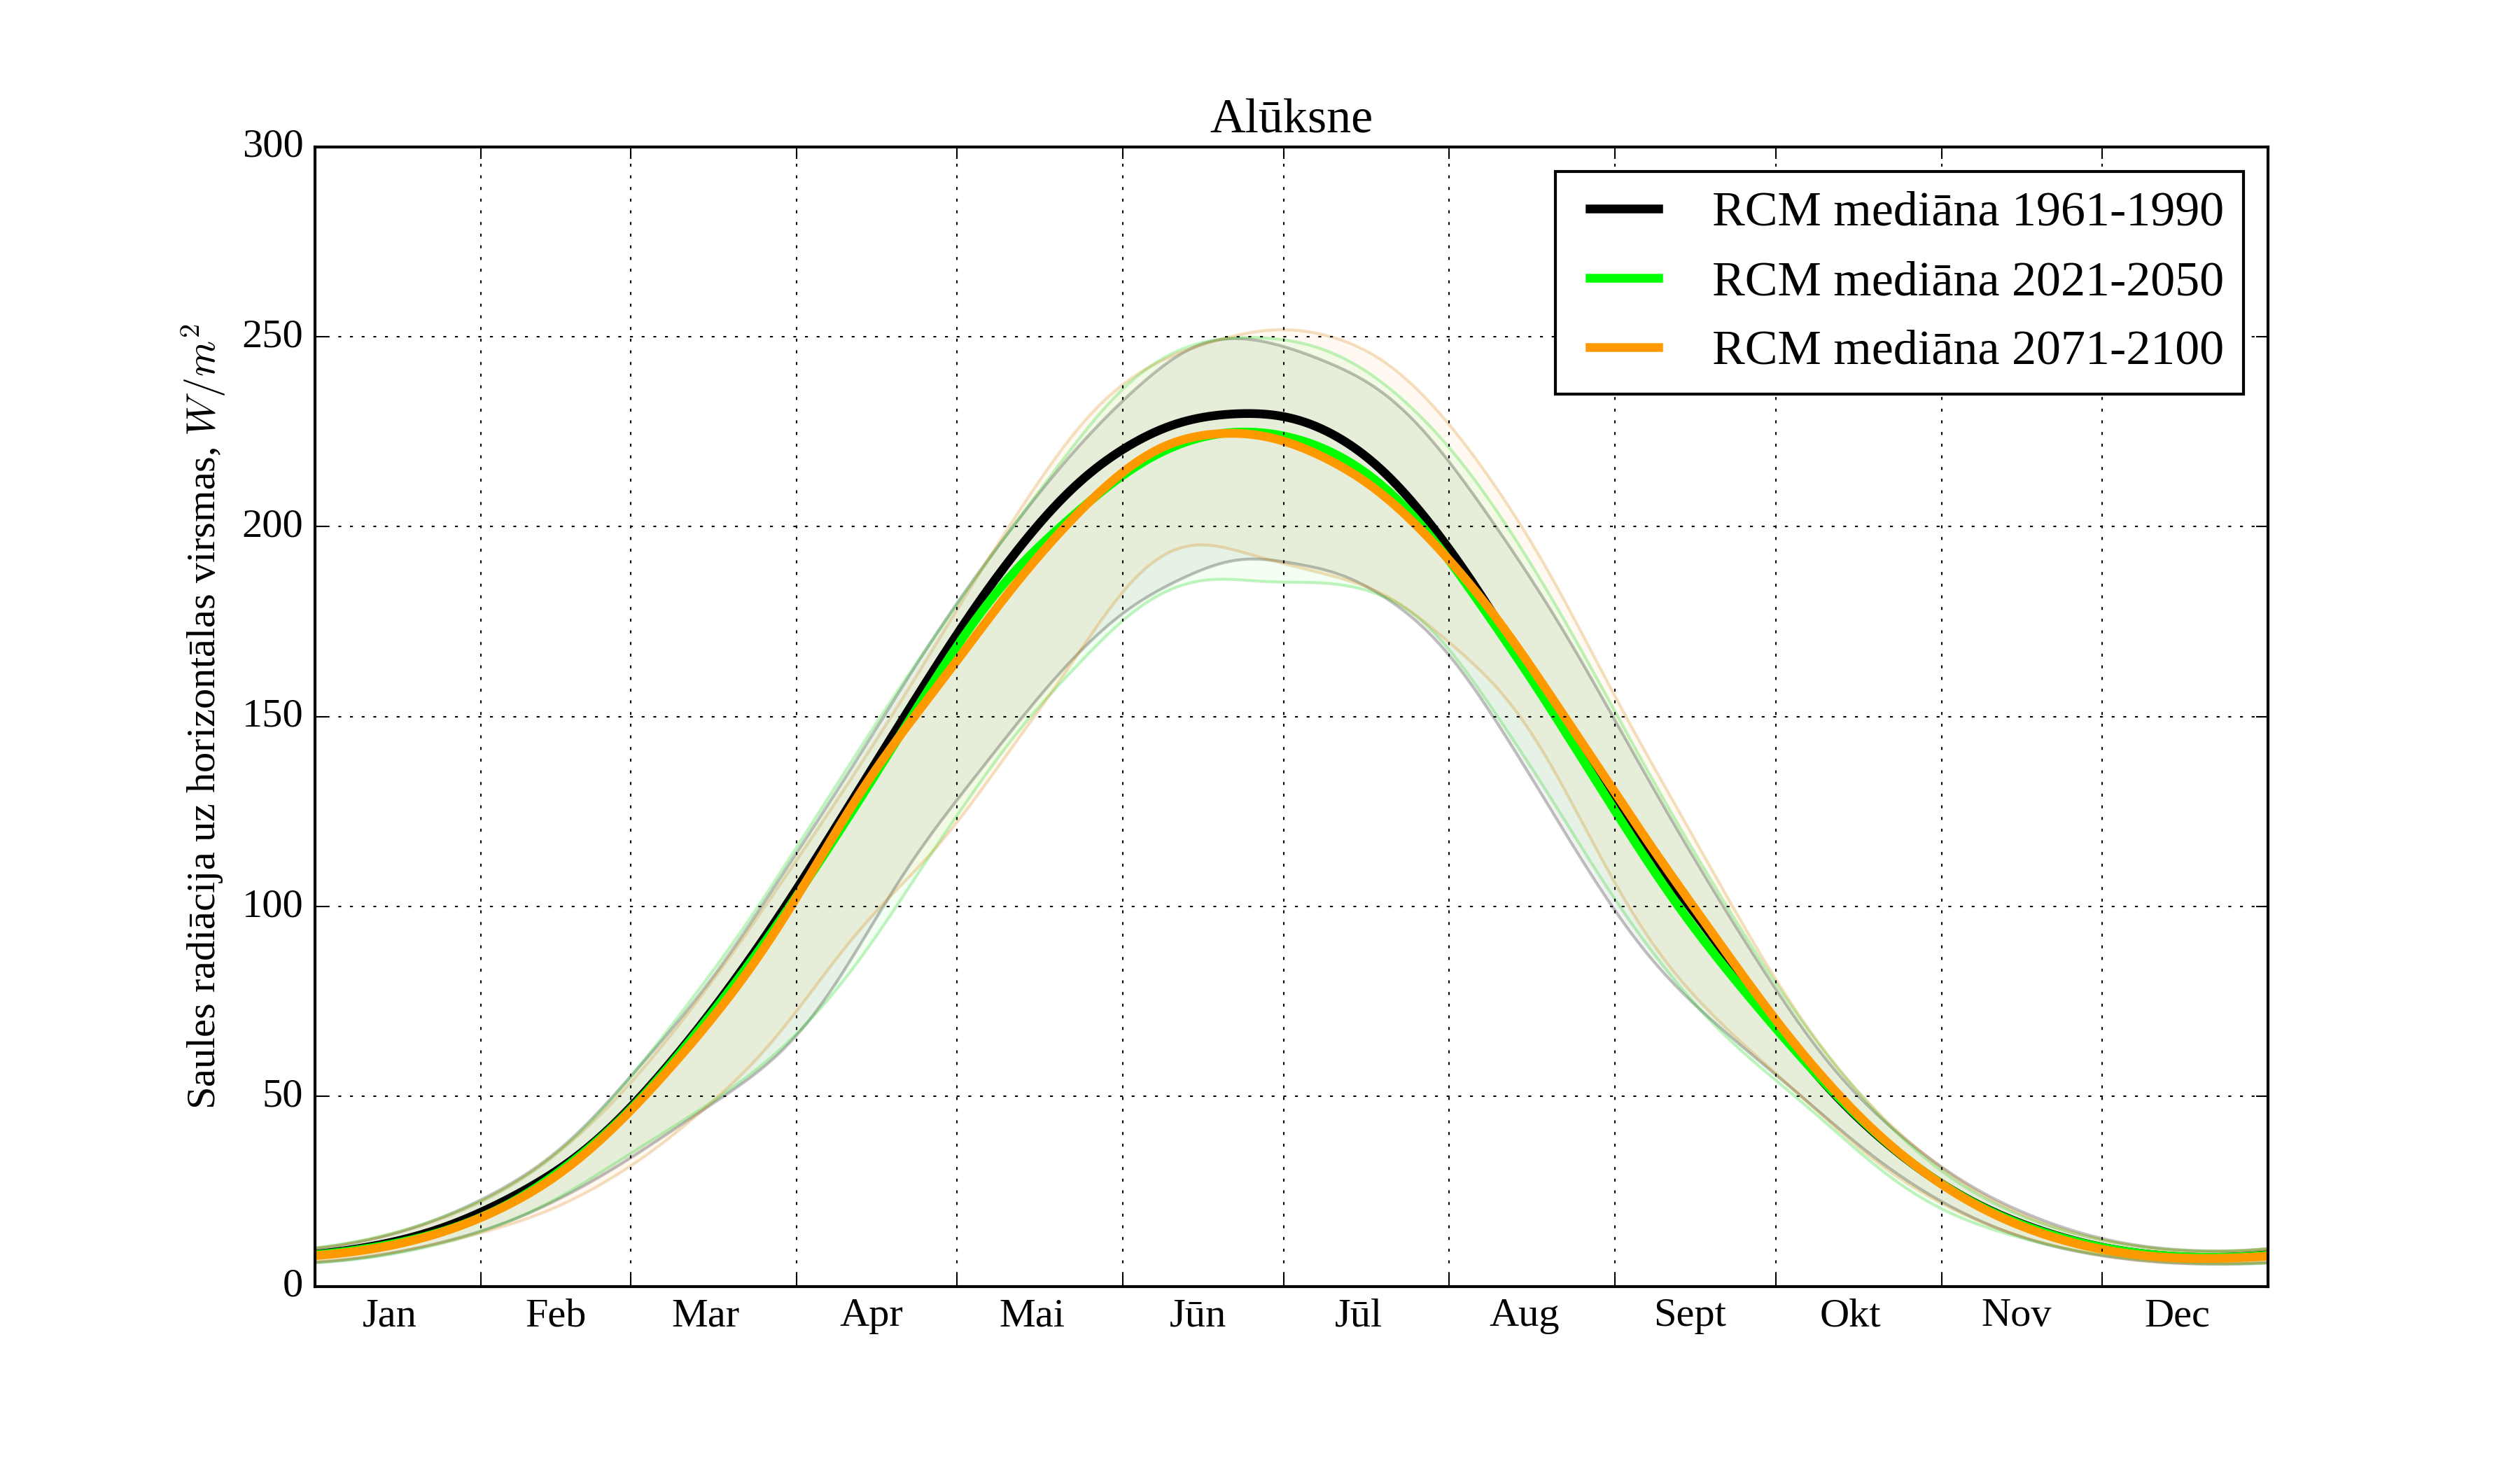
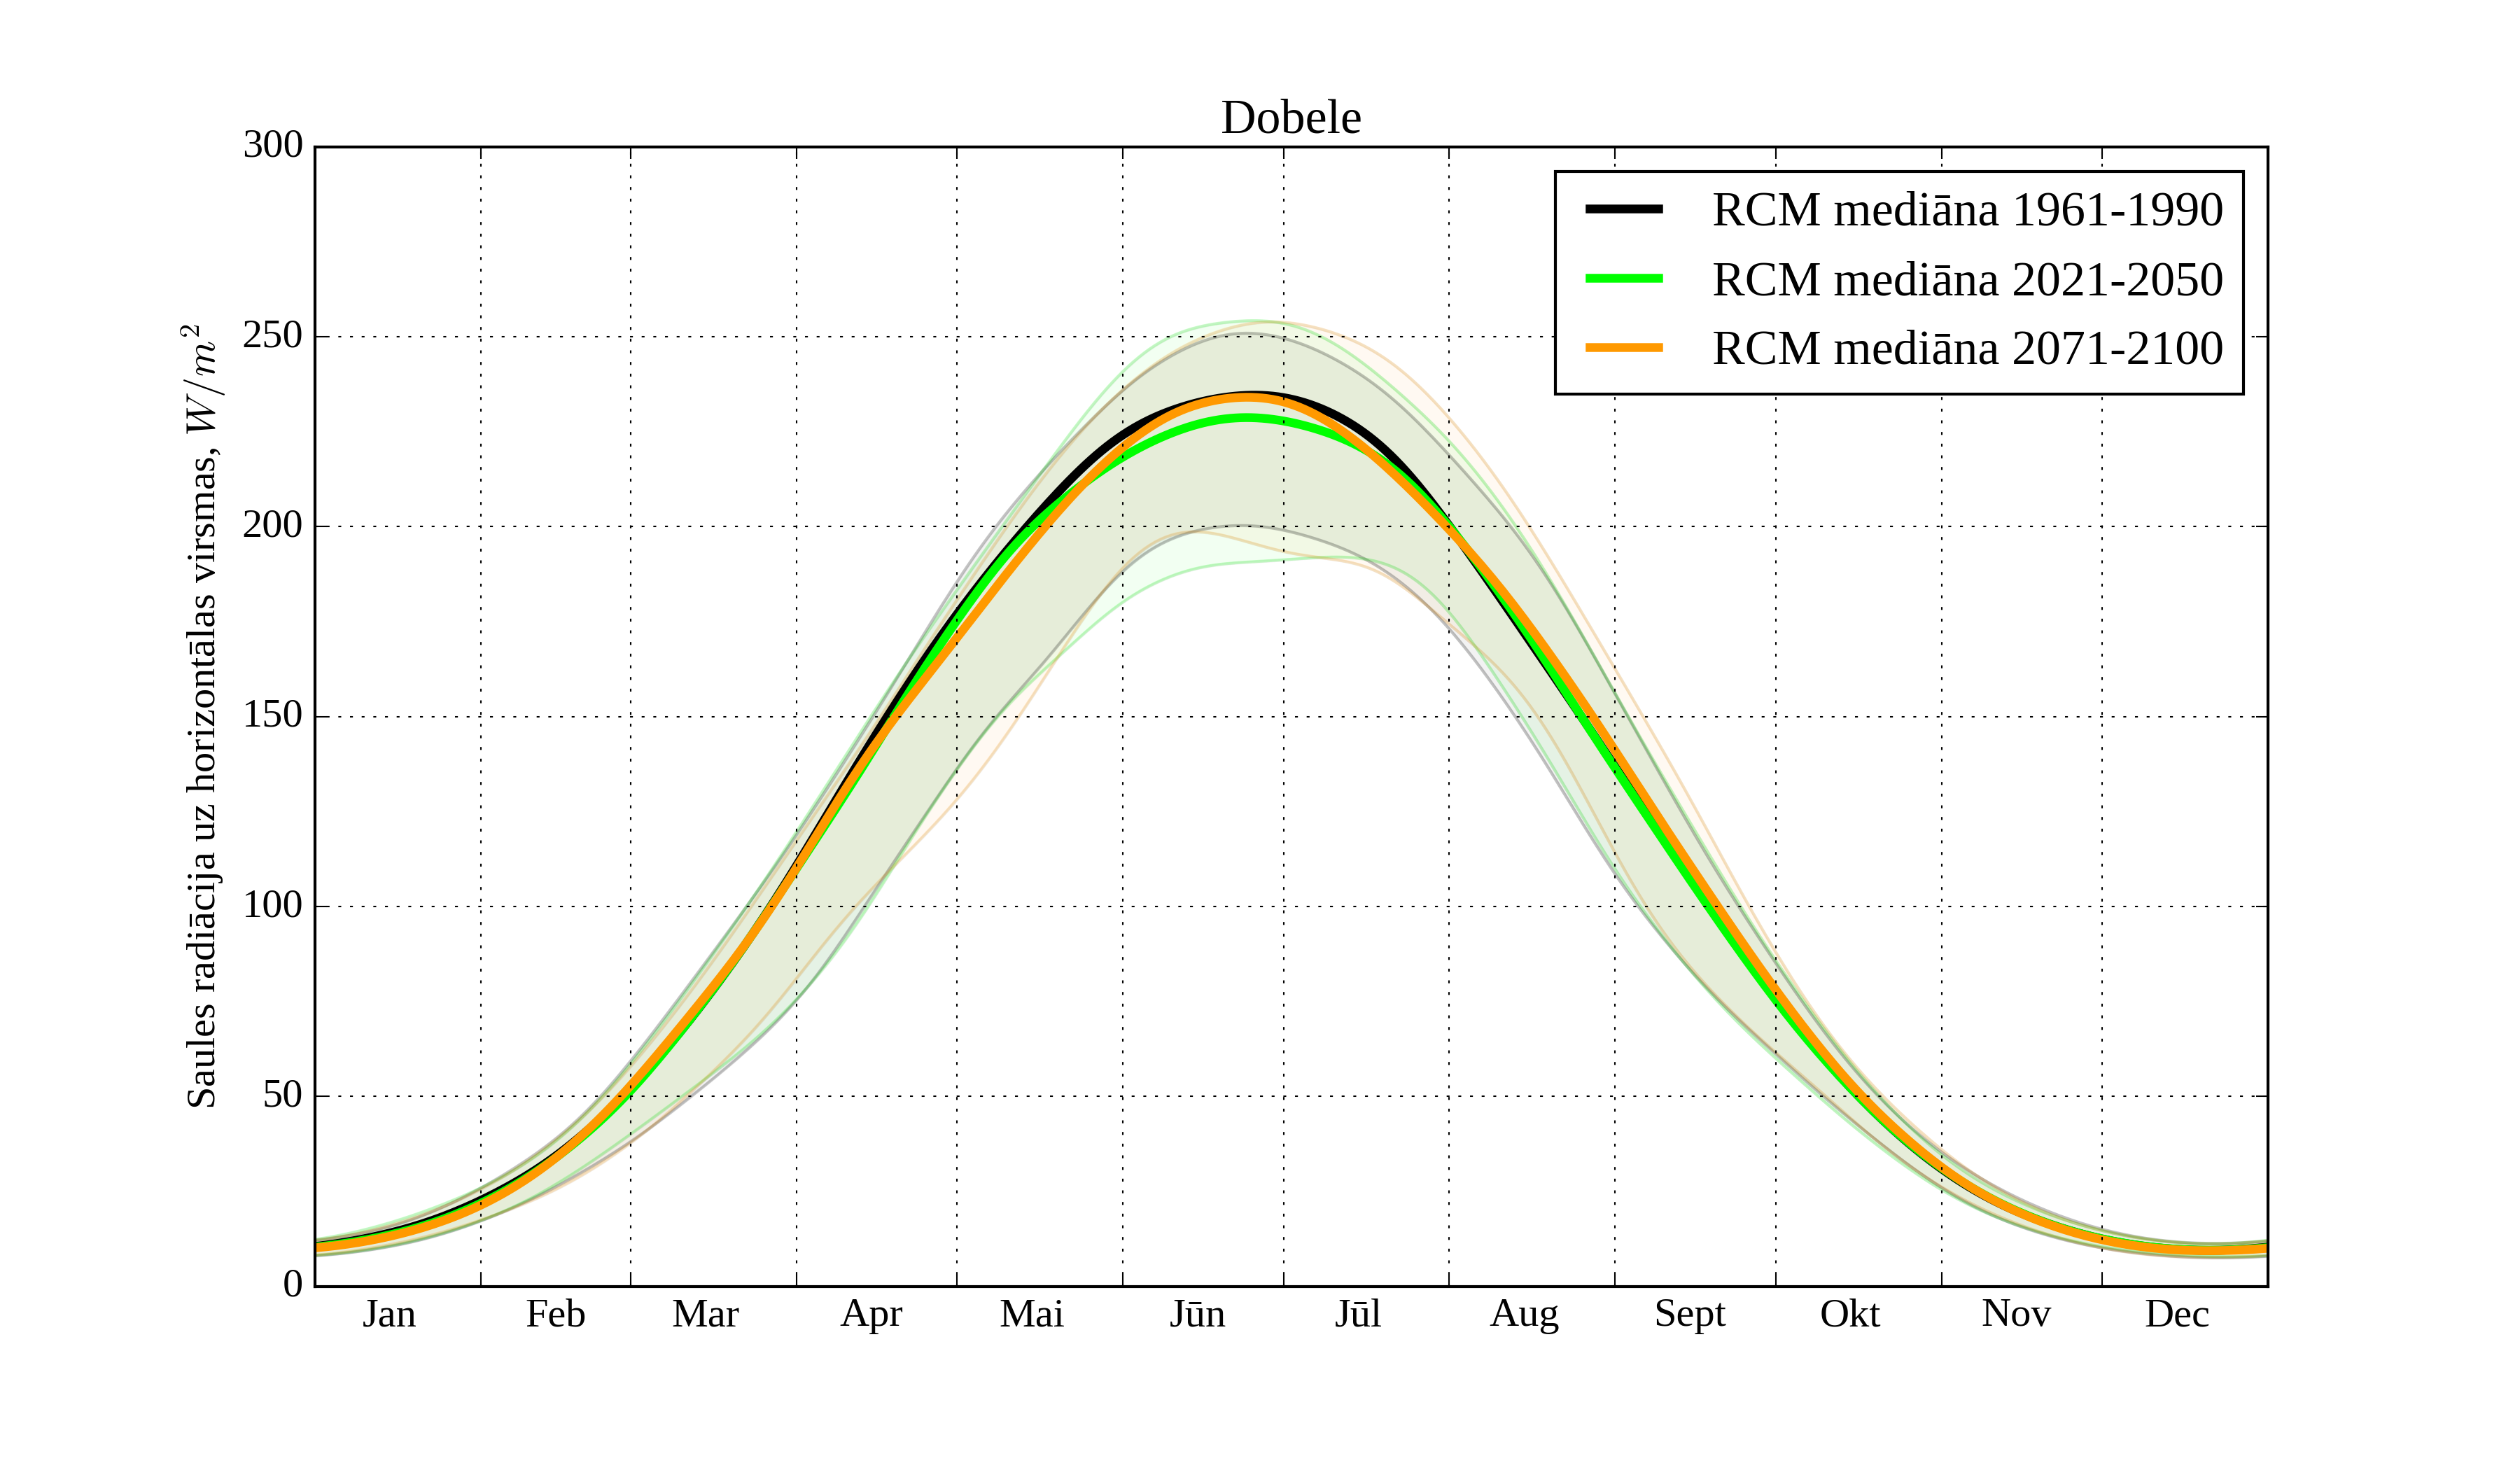
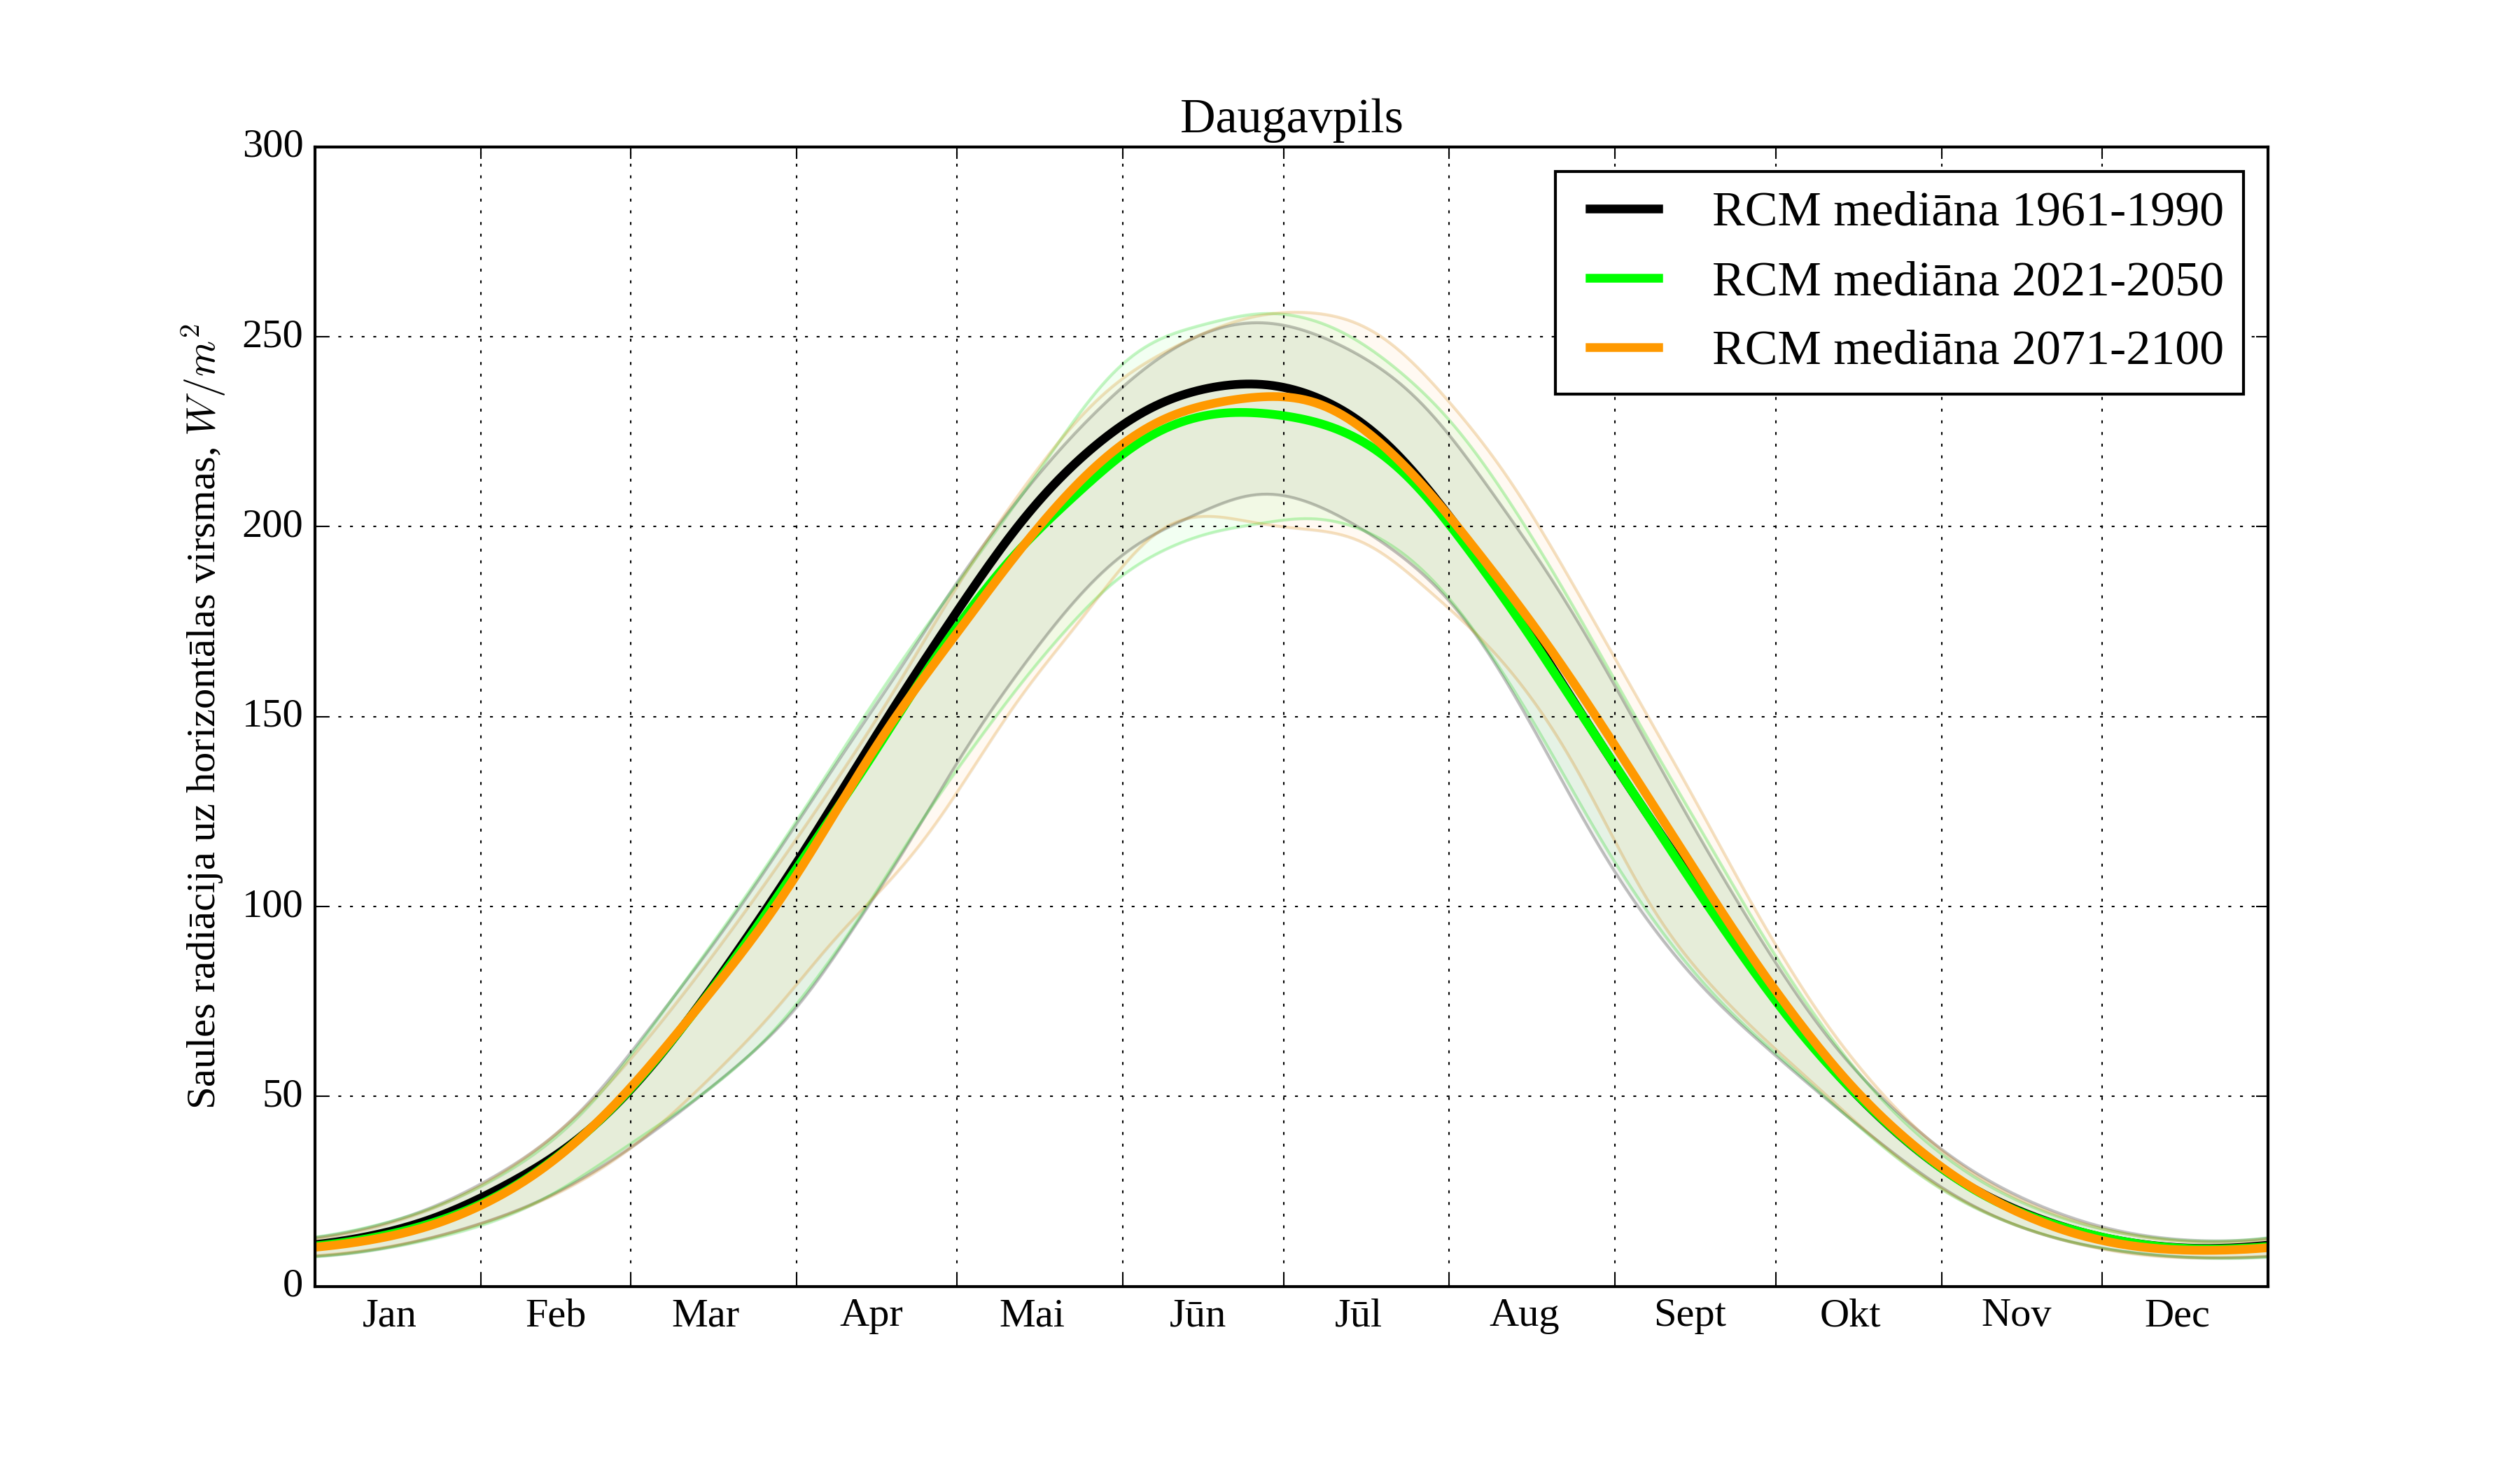
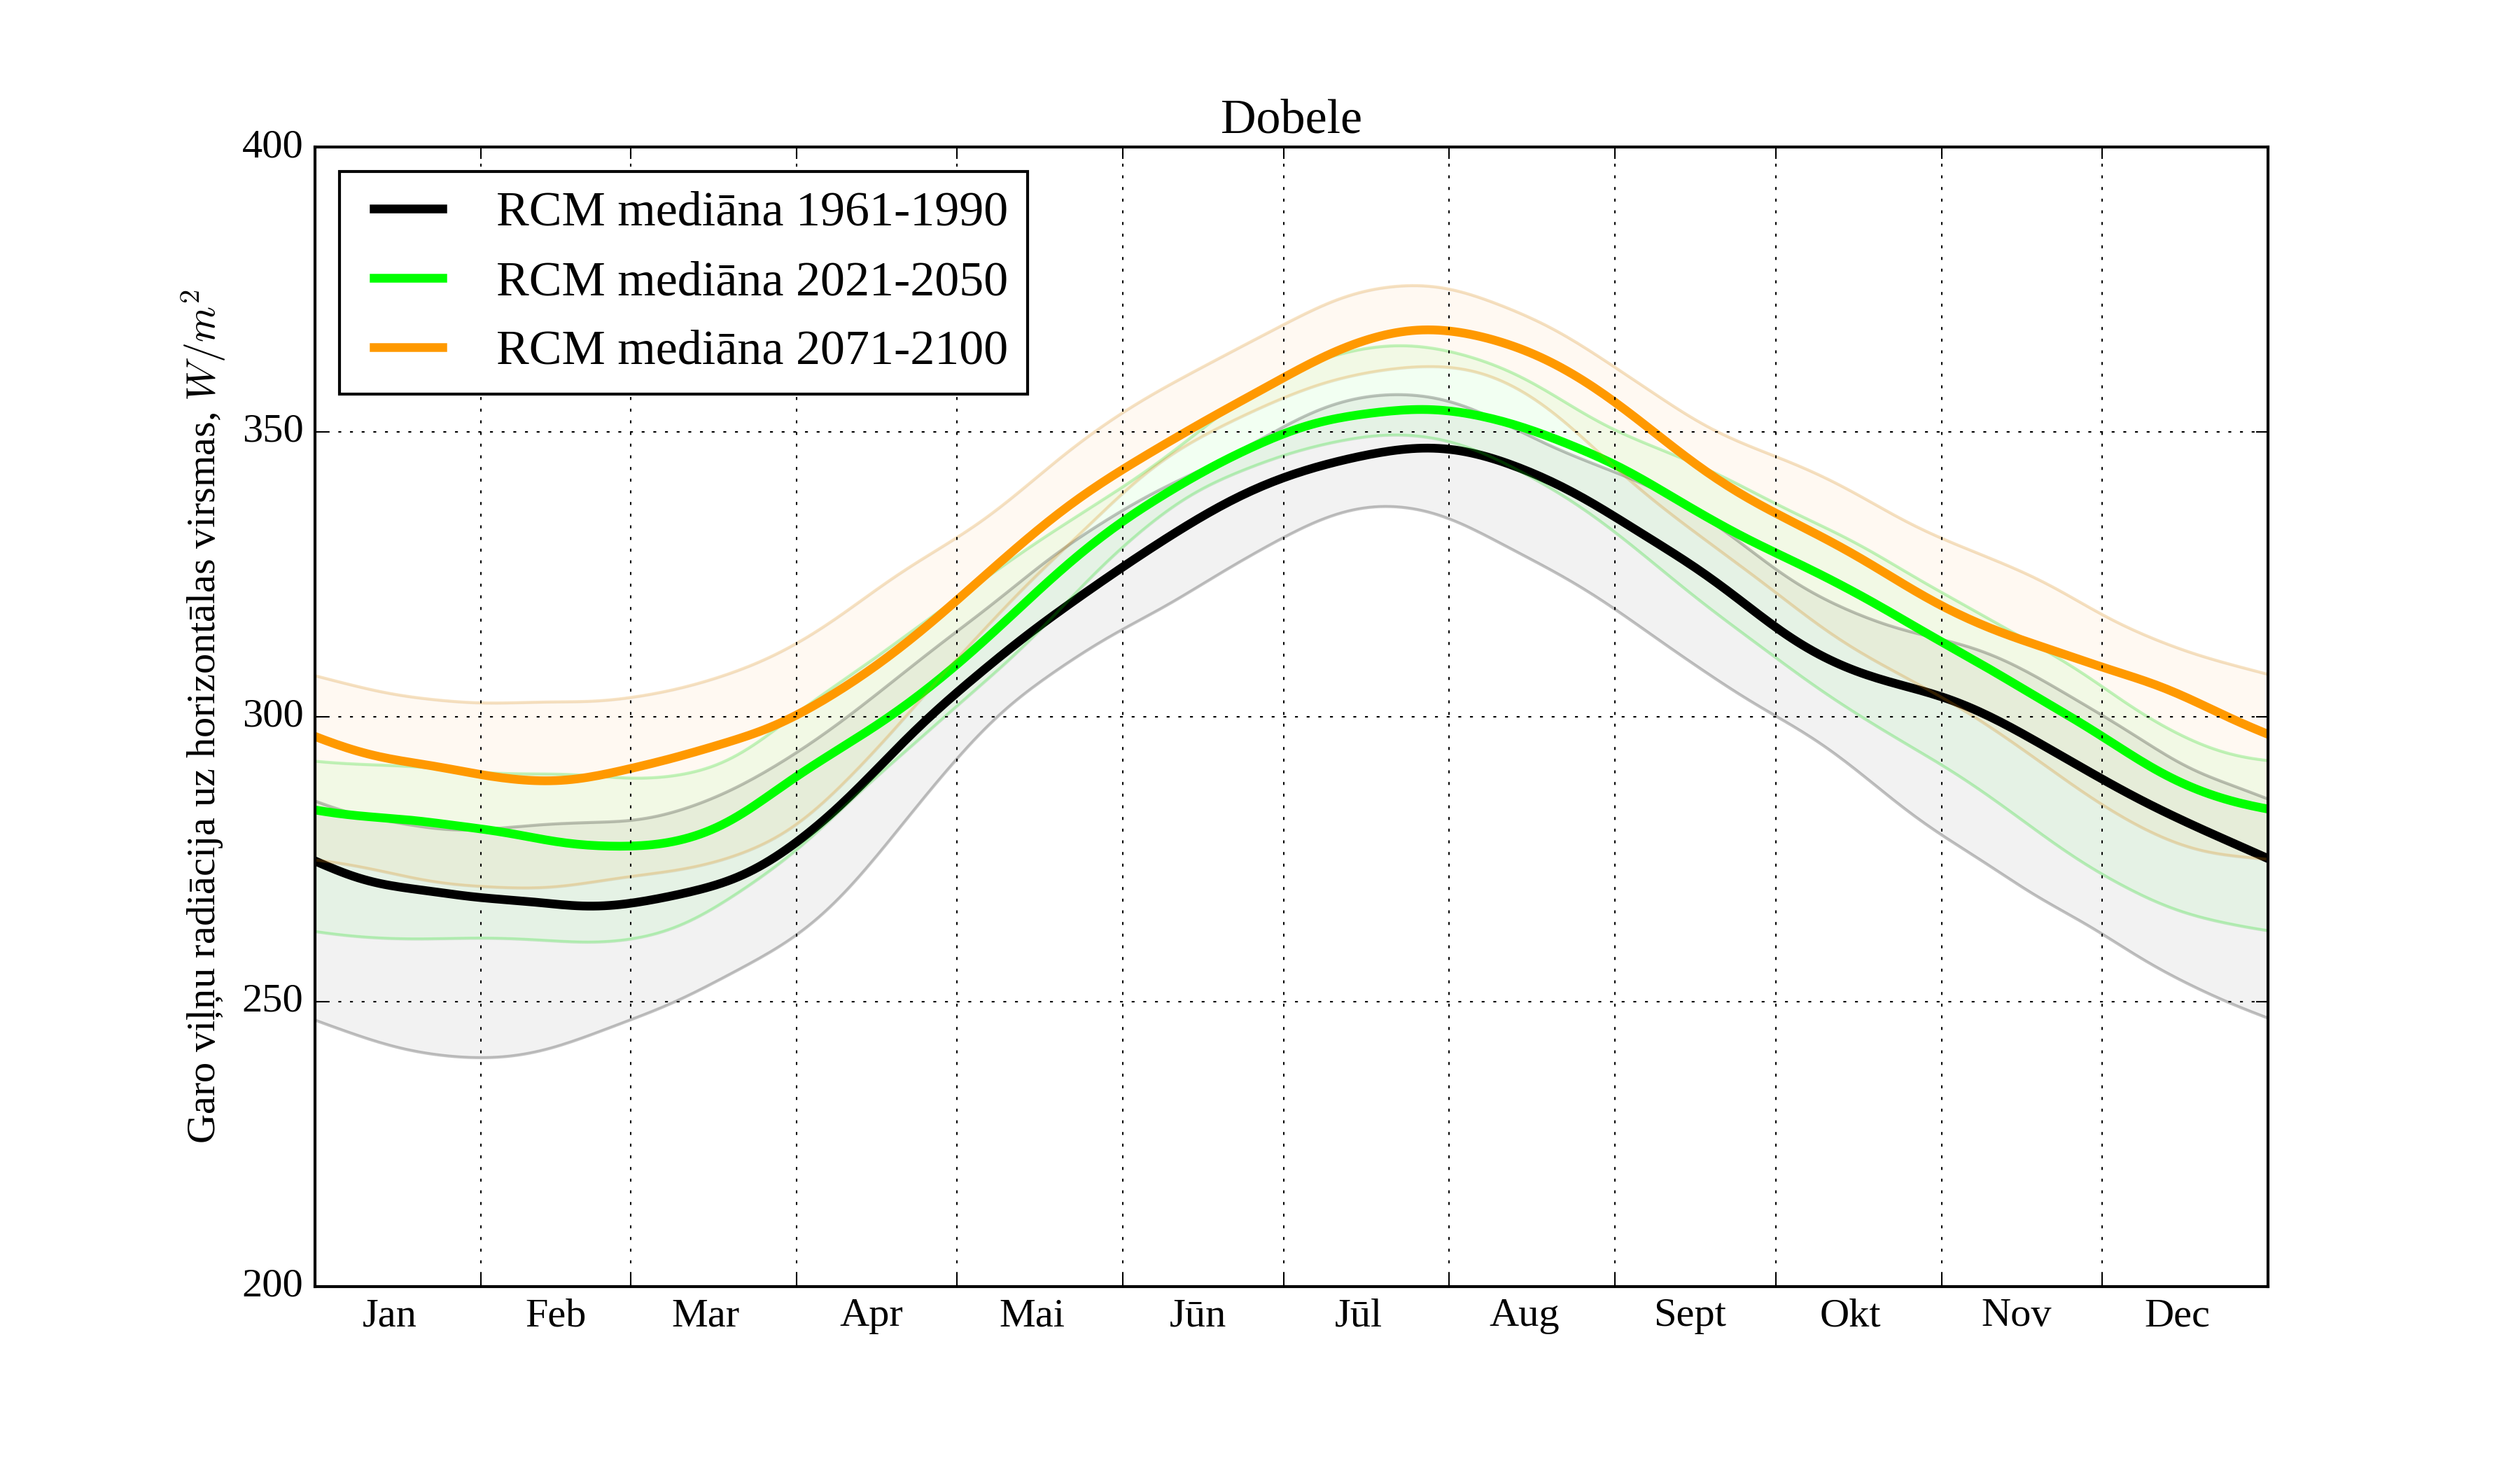
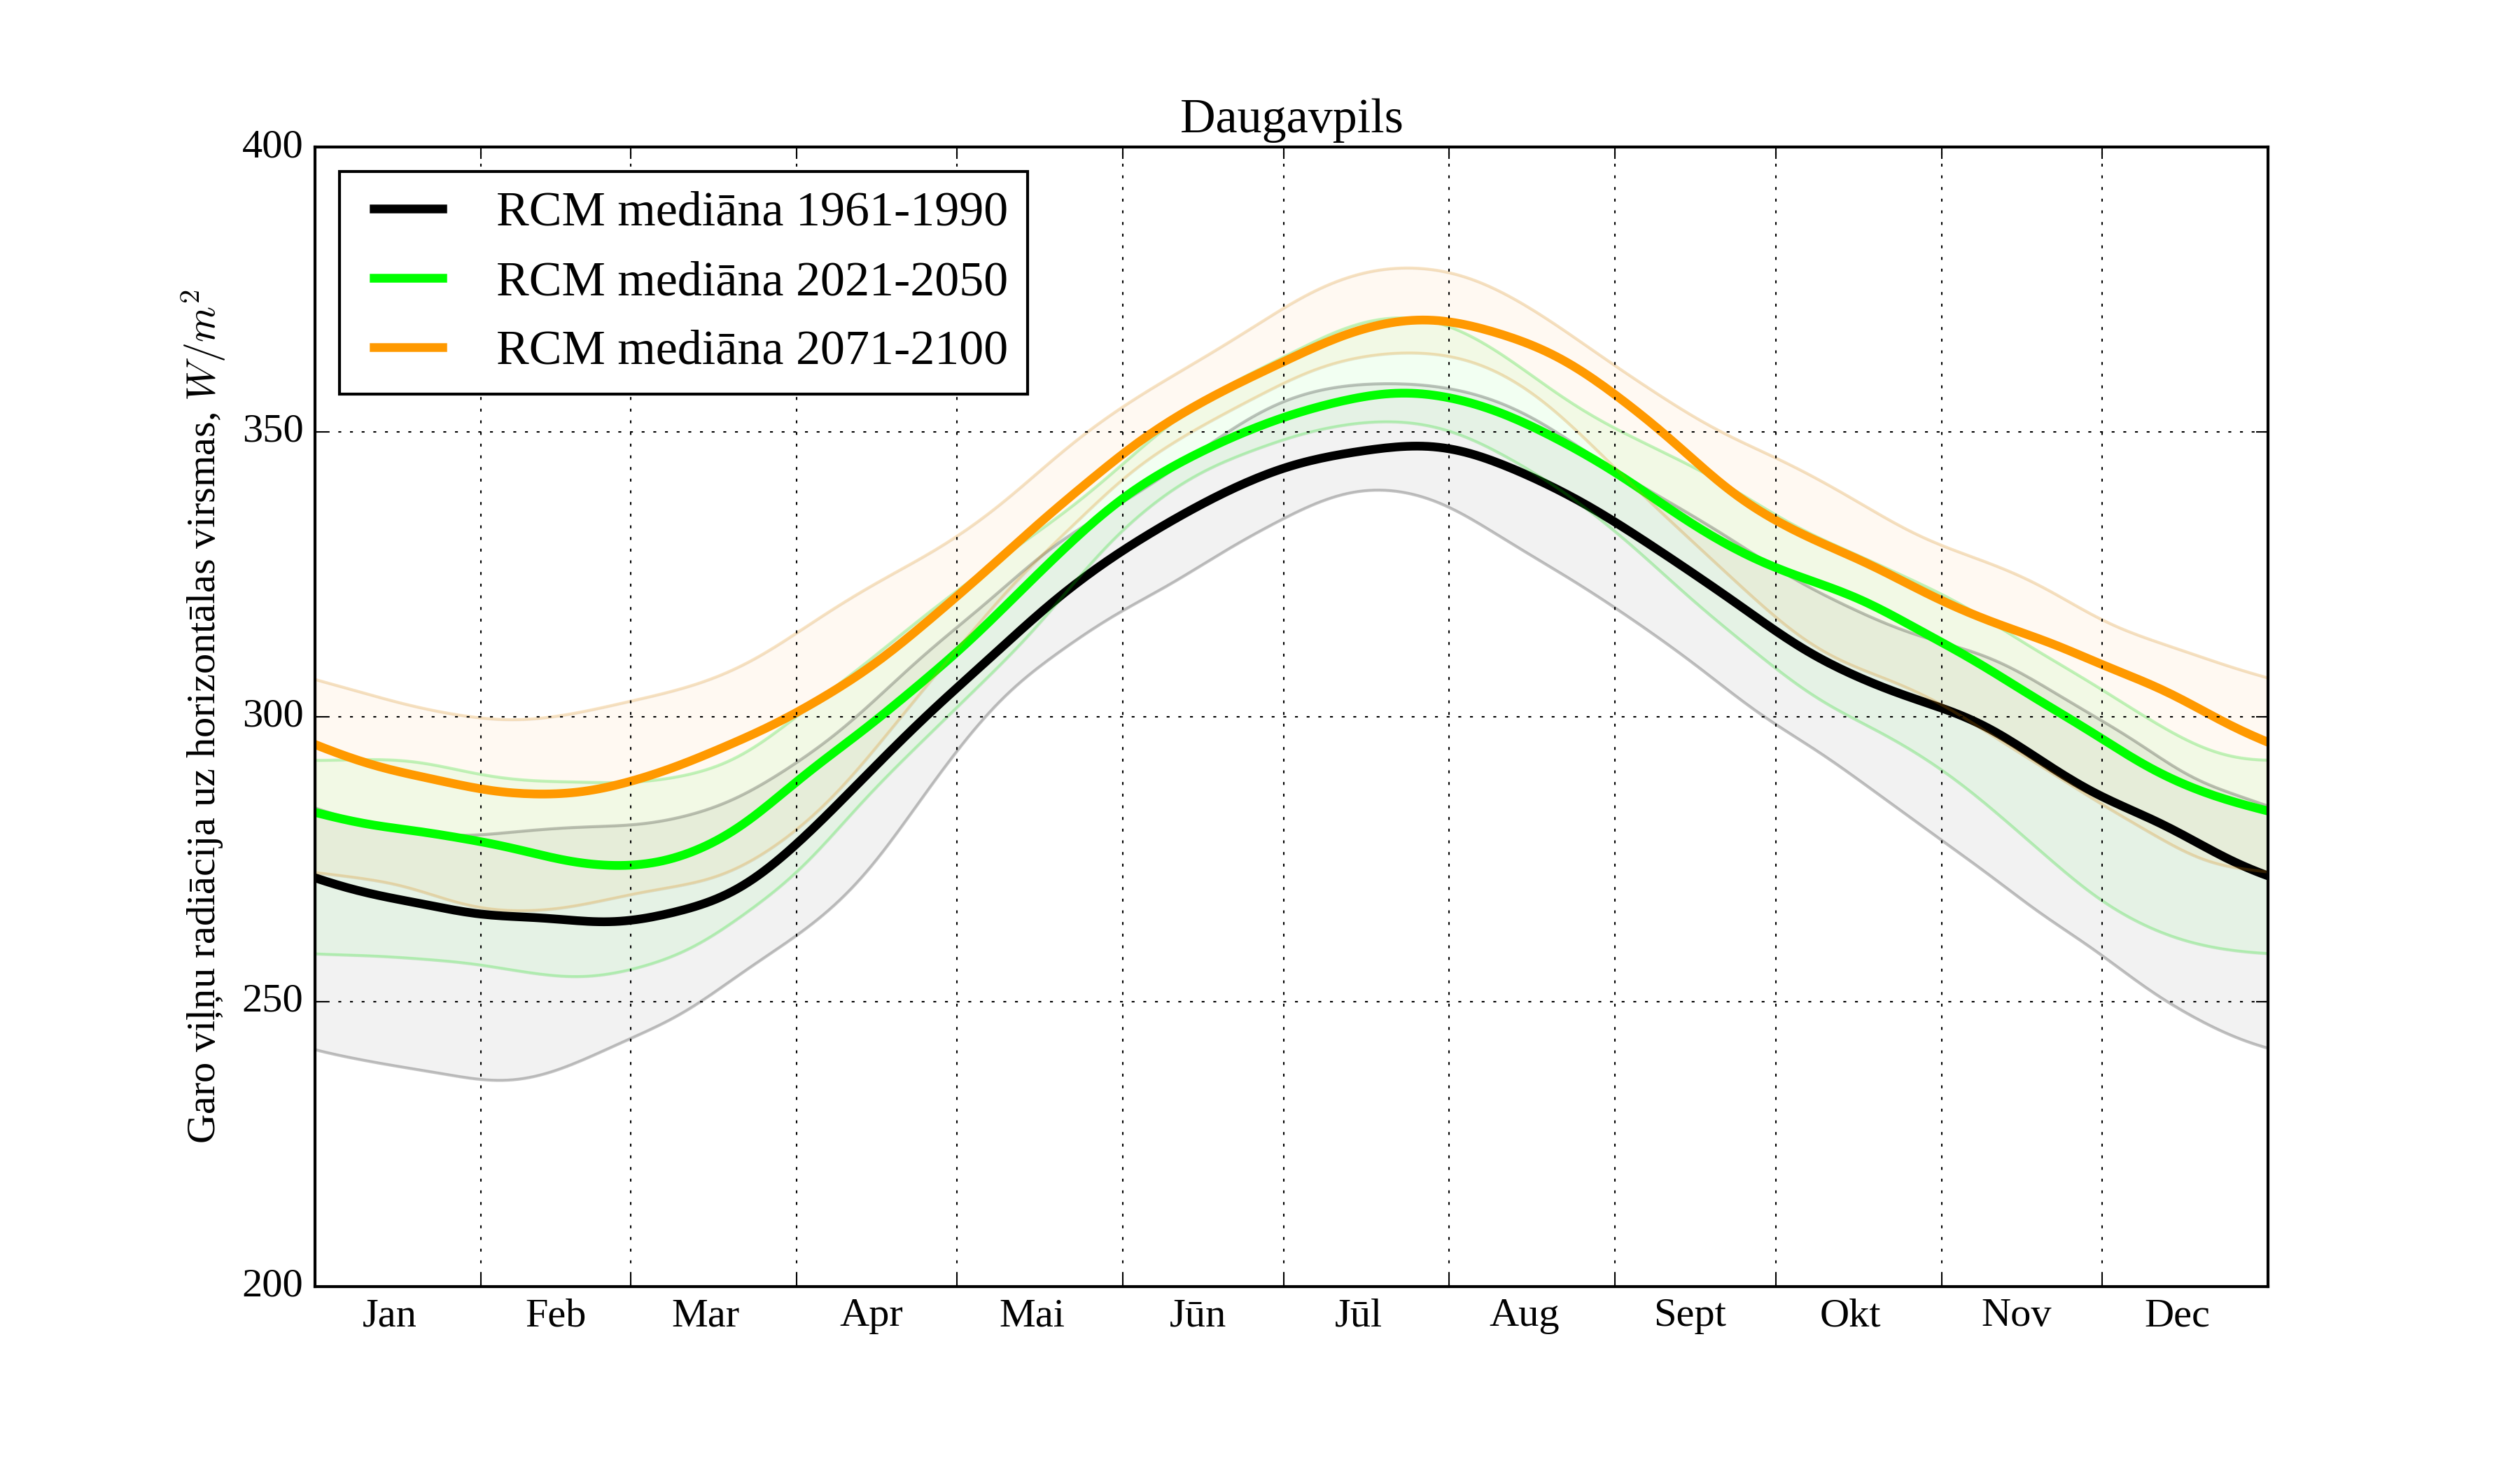
Now consider the climatological trend in montly distribution of solar radiation, see Figures 11-14.
Figure 11. Monthly solar irradiation on horizontal surface for different climatological periods in Kolka
Figure 12. Monthly solar irradiation on horizontal surface for different climatological periods in Aluksne
Figure 13. Monthly solar irradiation on horizontal surface for different climatological periods in Dobele
Figure 14. Monthly solar irradiation on horizontal surface for different climatological periods in Daugavpils
All land stations have similar trend of monthly distribution of solar irradiation.
However, coast stations like Kolka looks different with lower yearly increase in May, June.
Land stations experience slight decrease of solar irradiation in spring and summer.
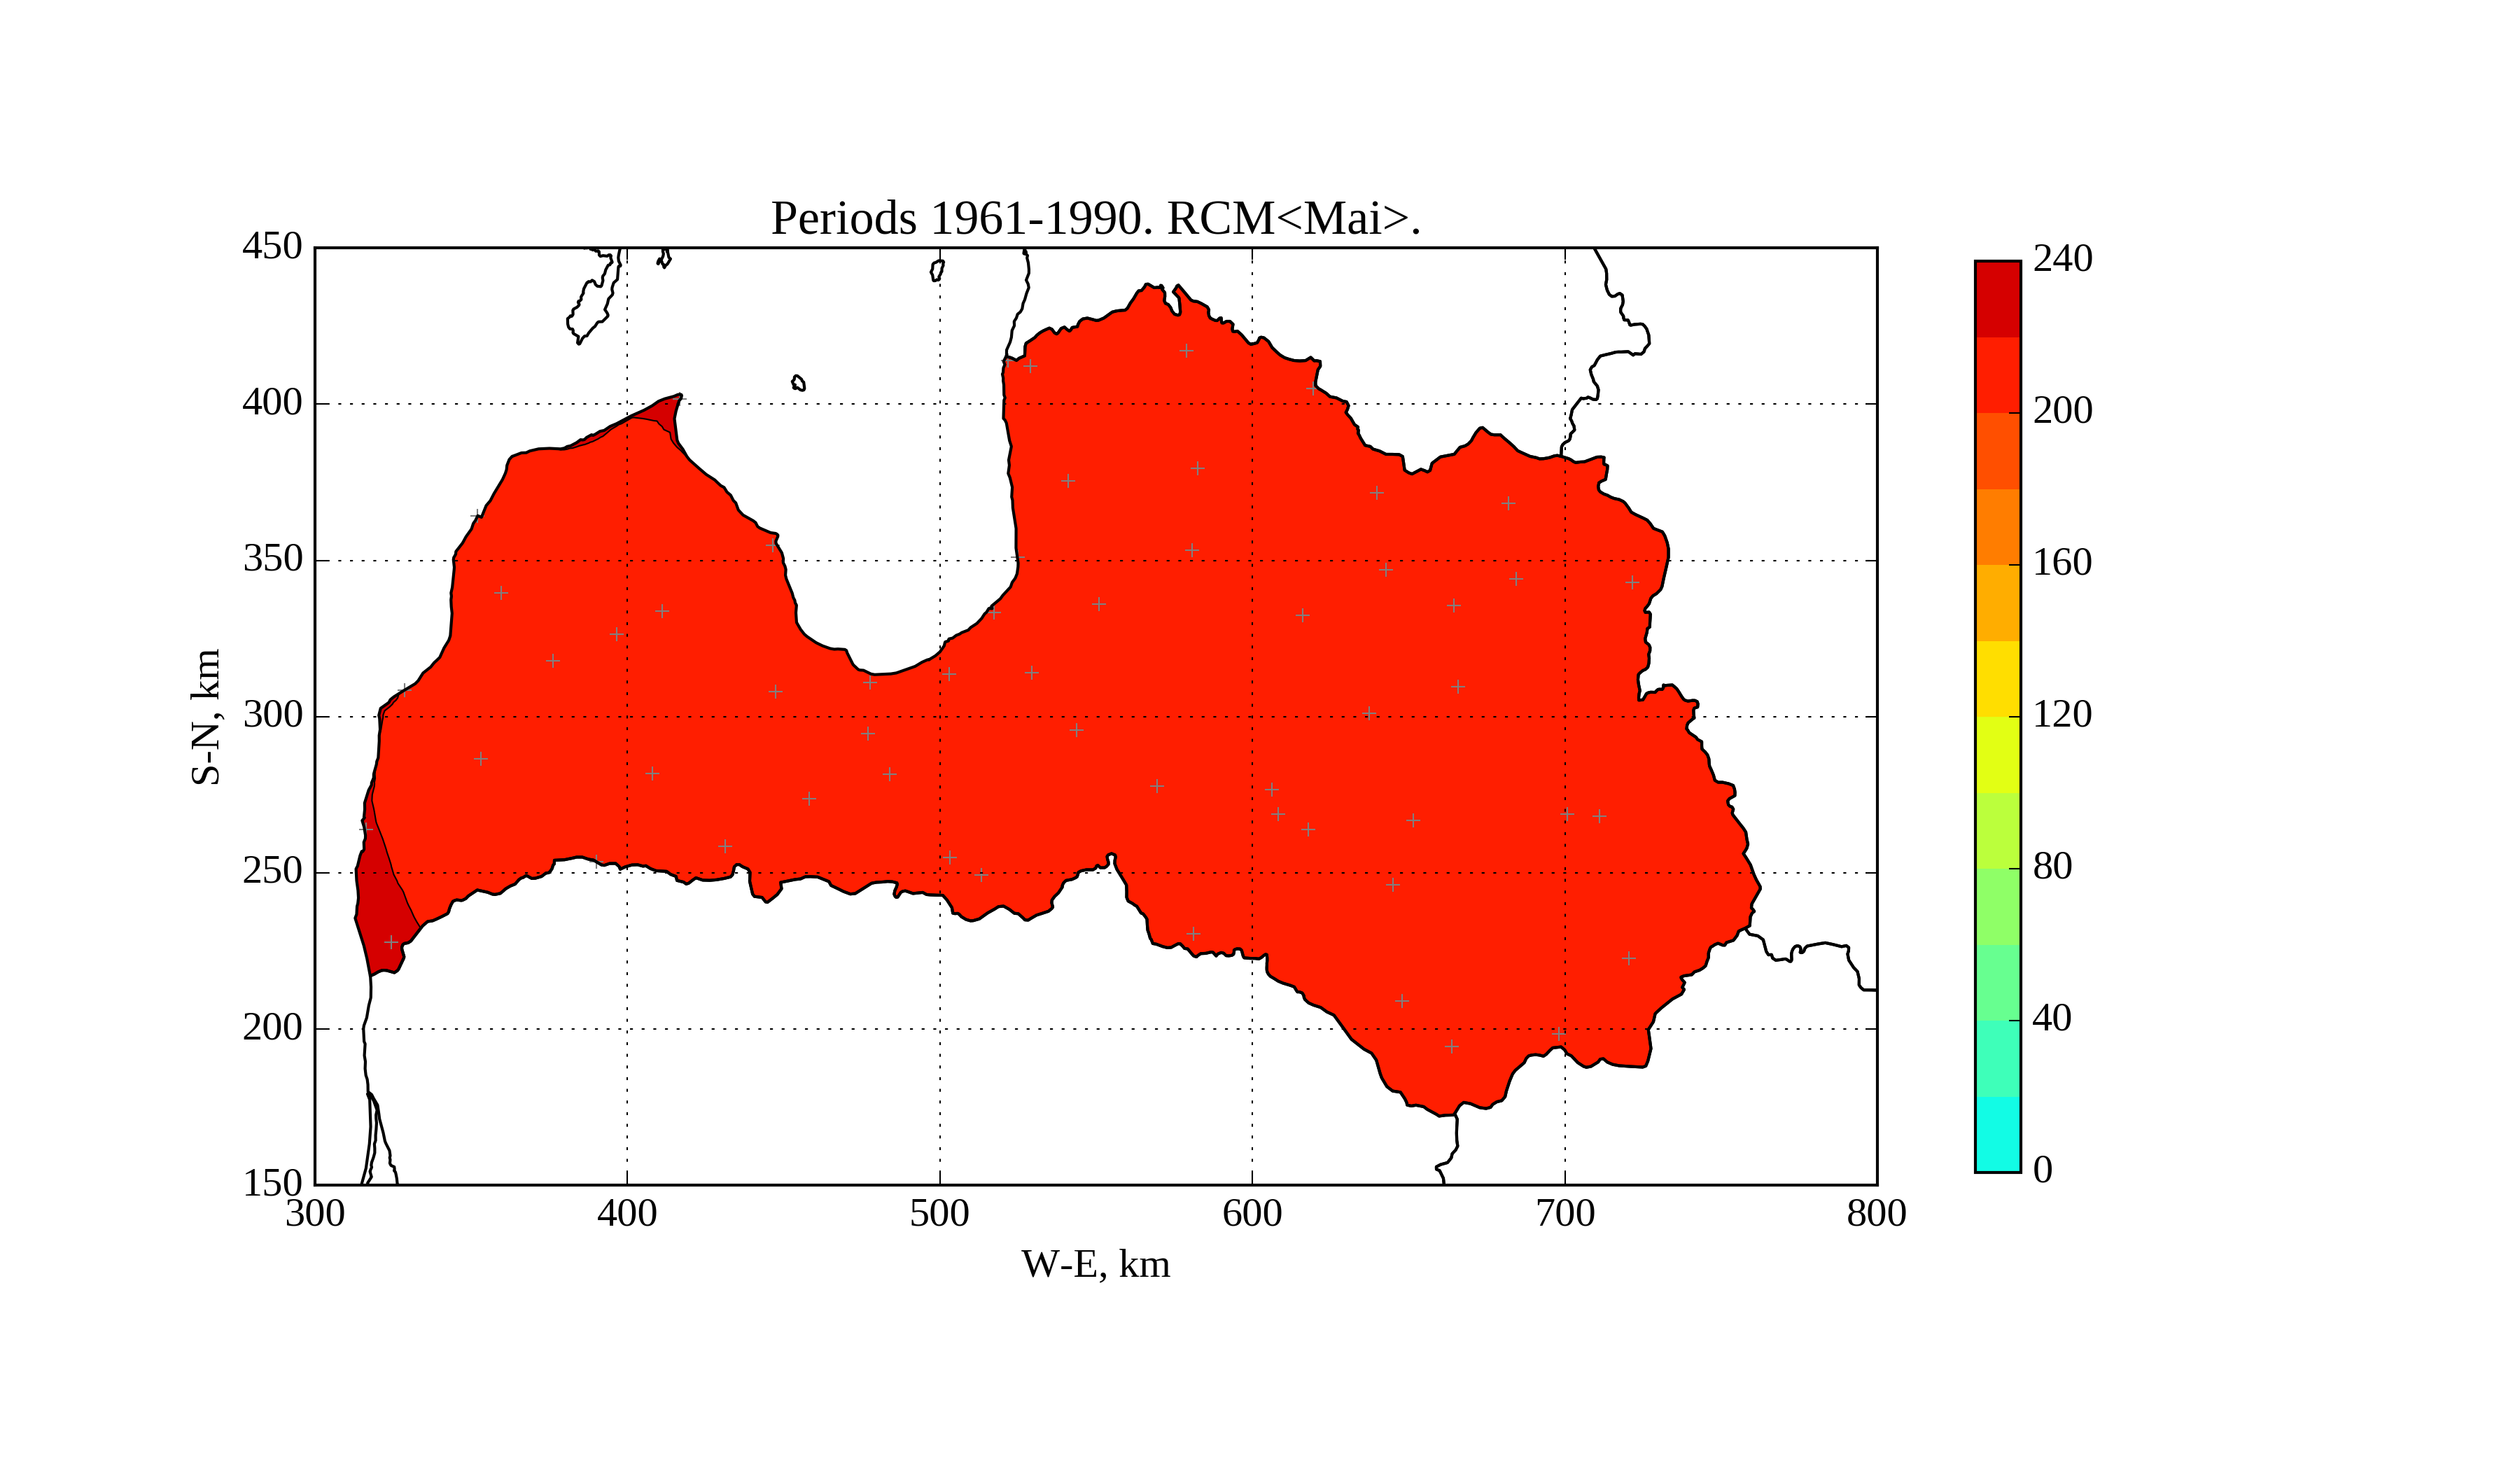
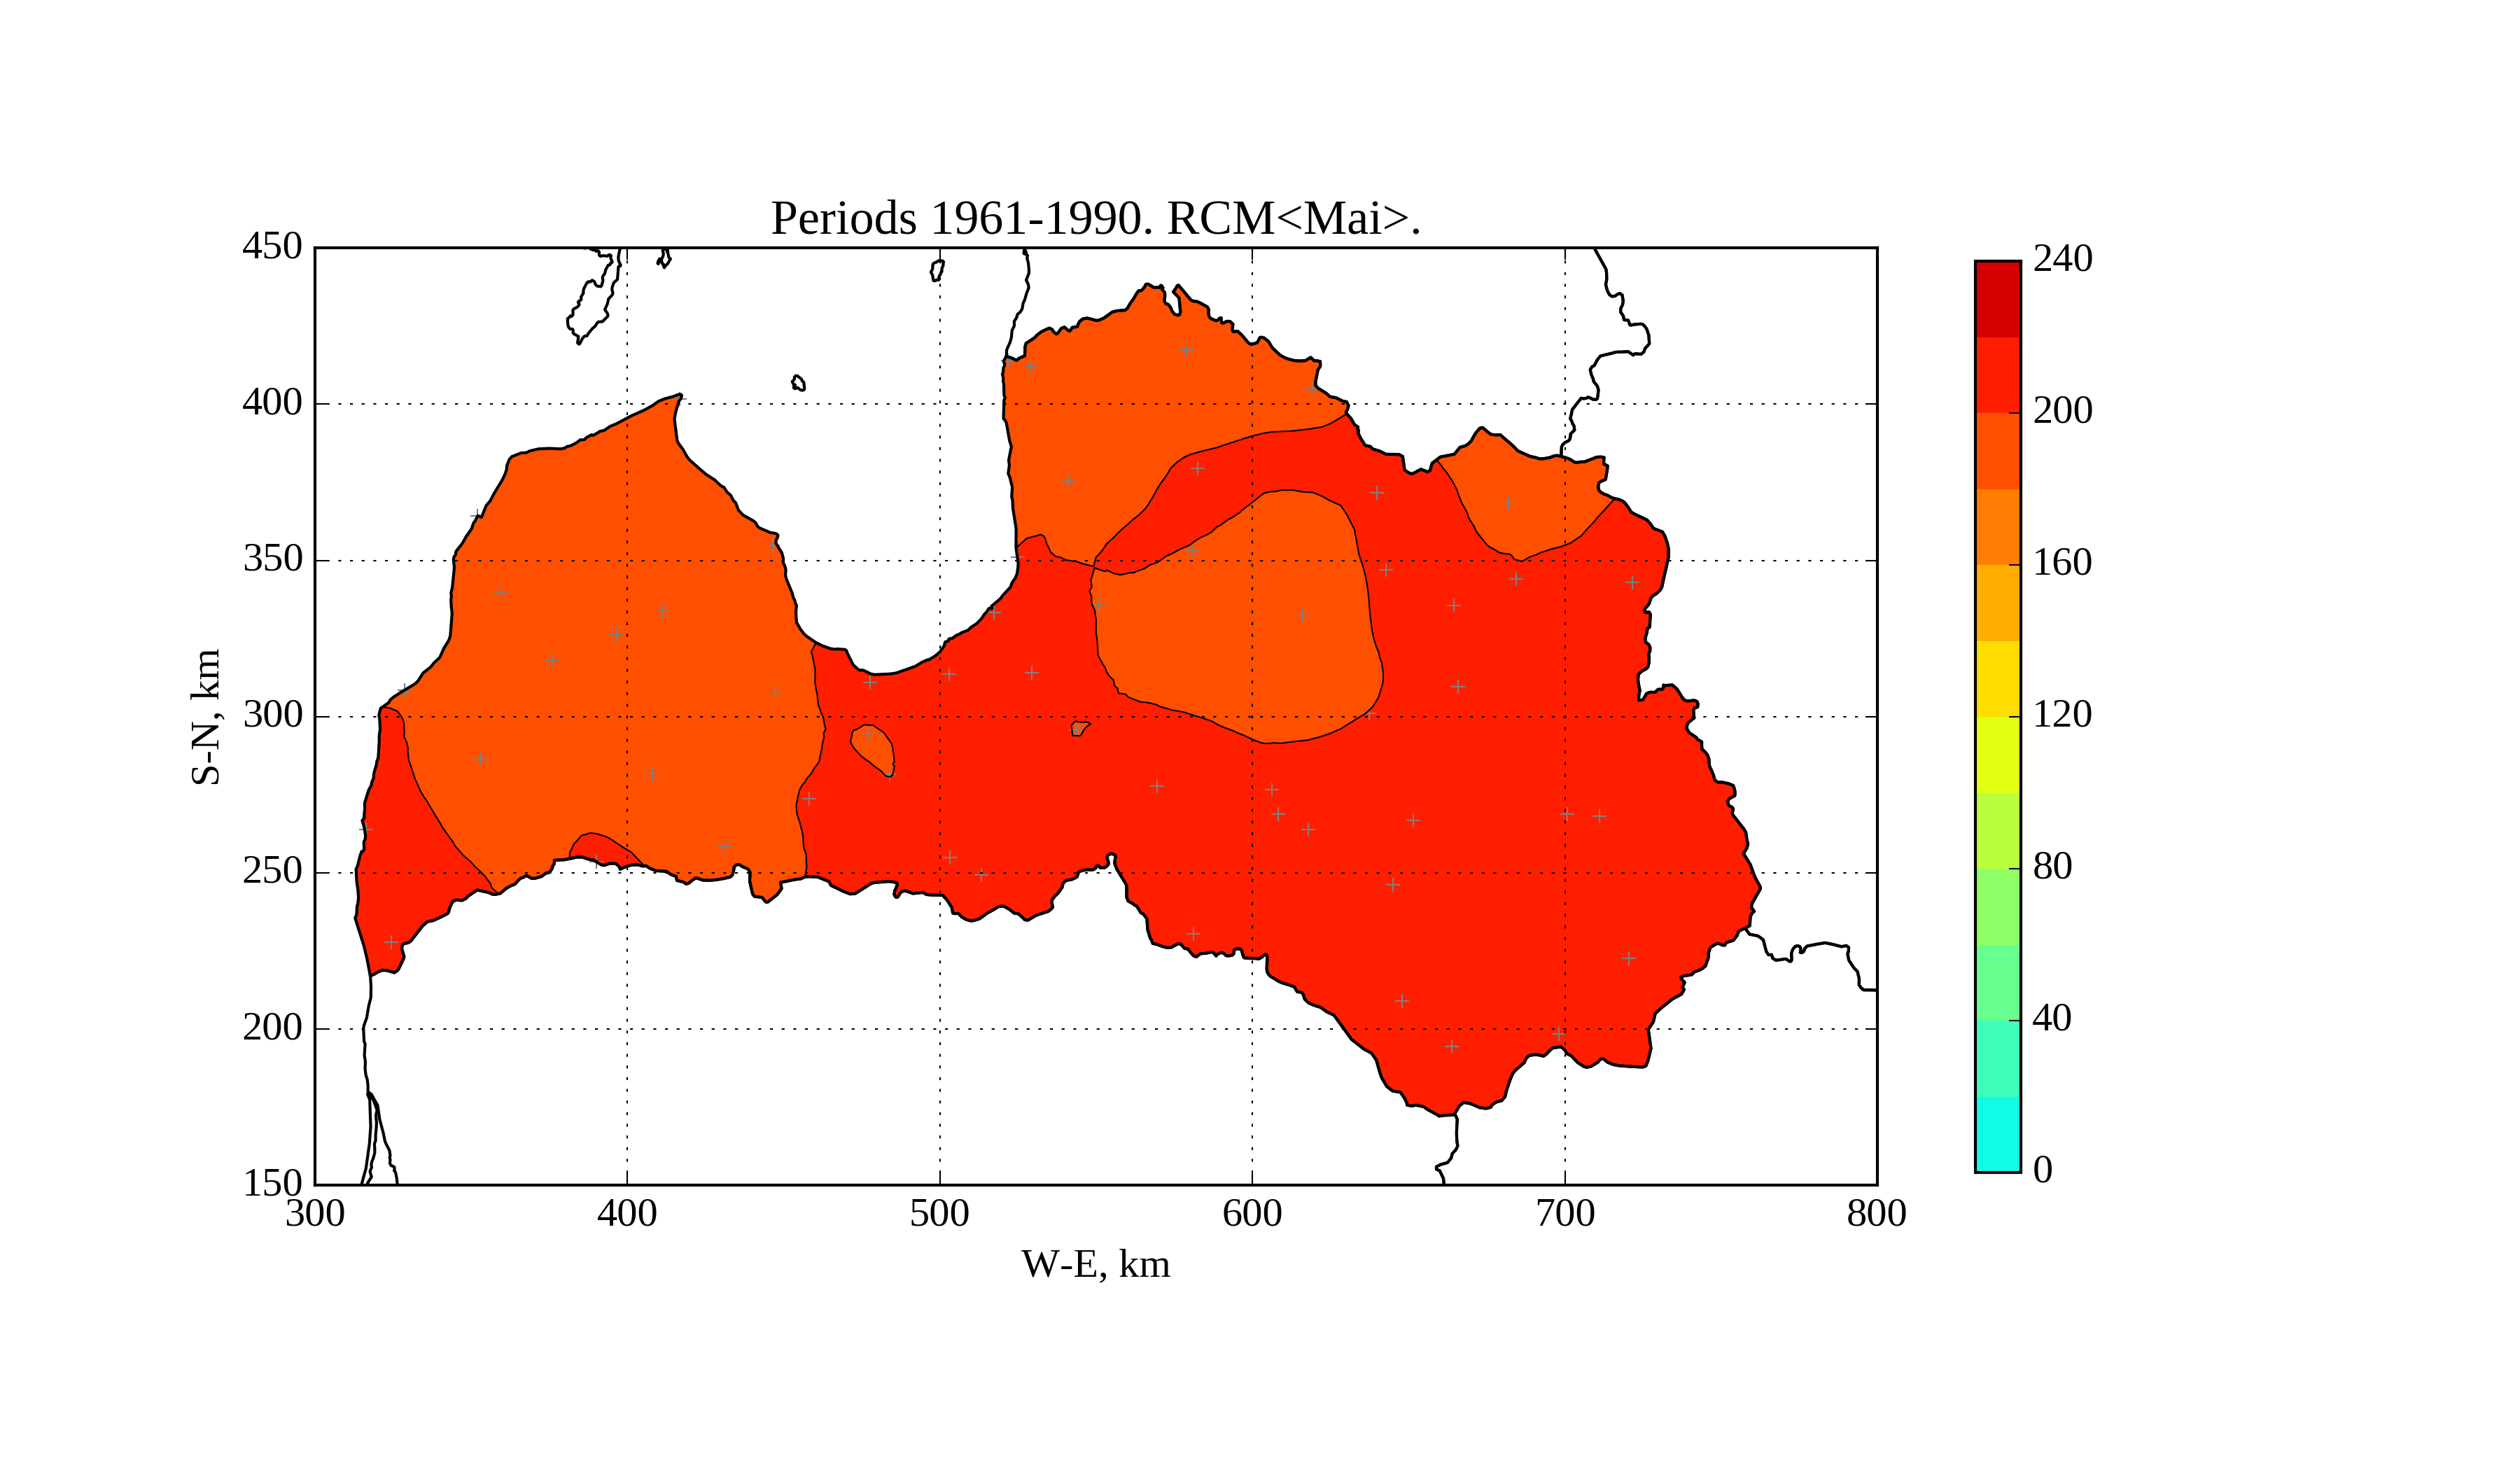
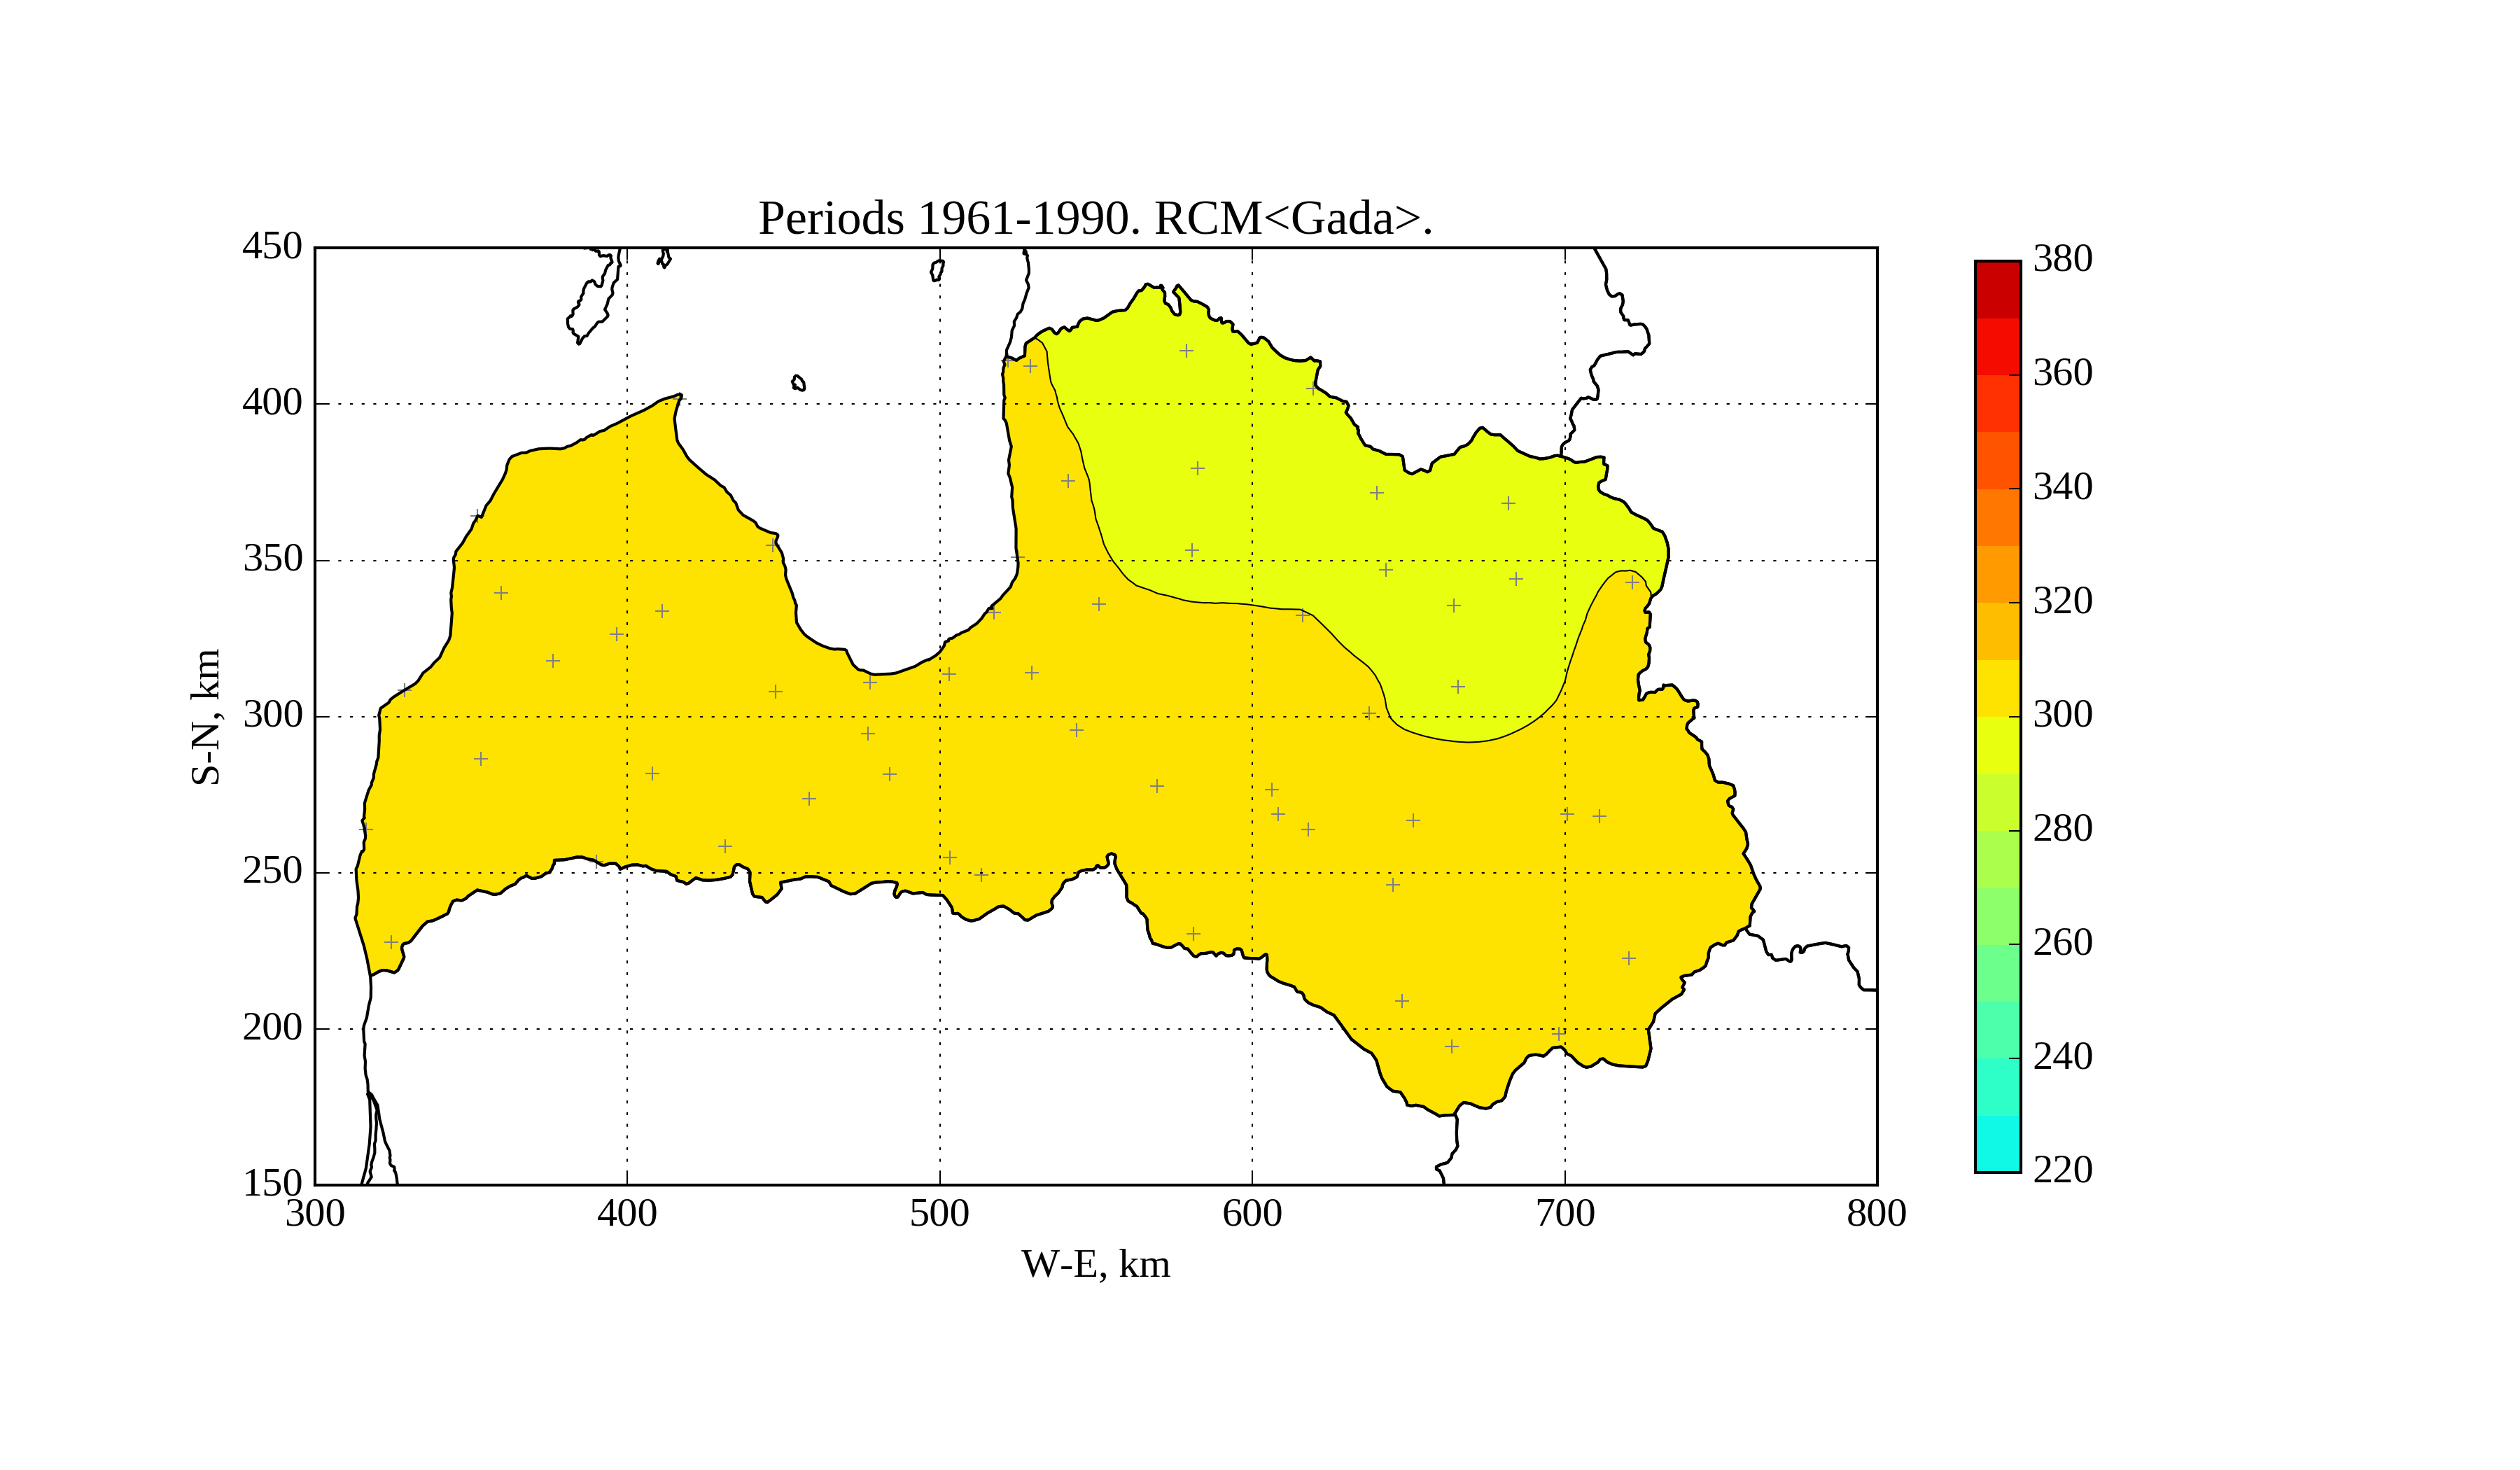
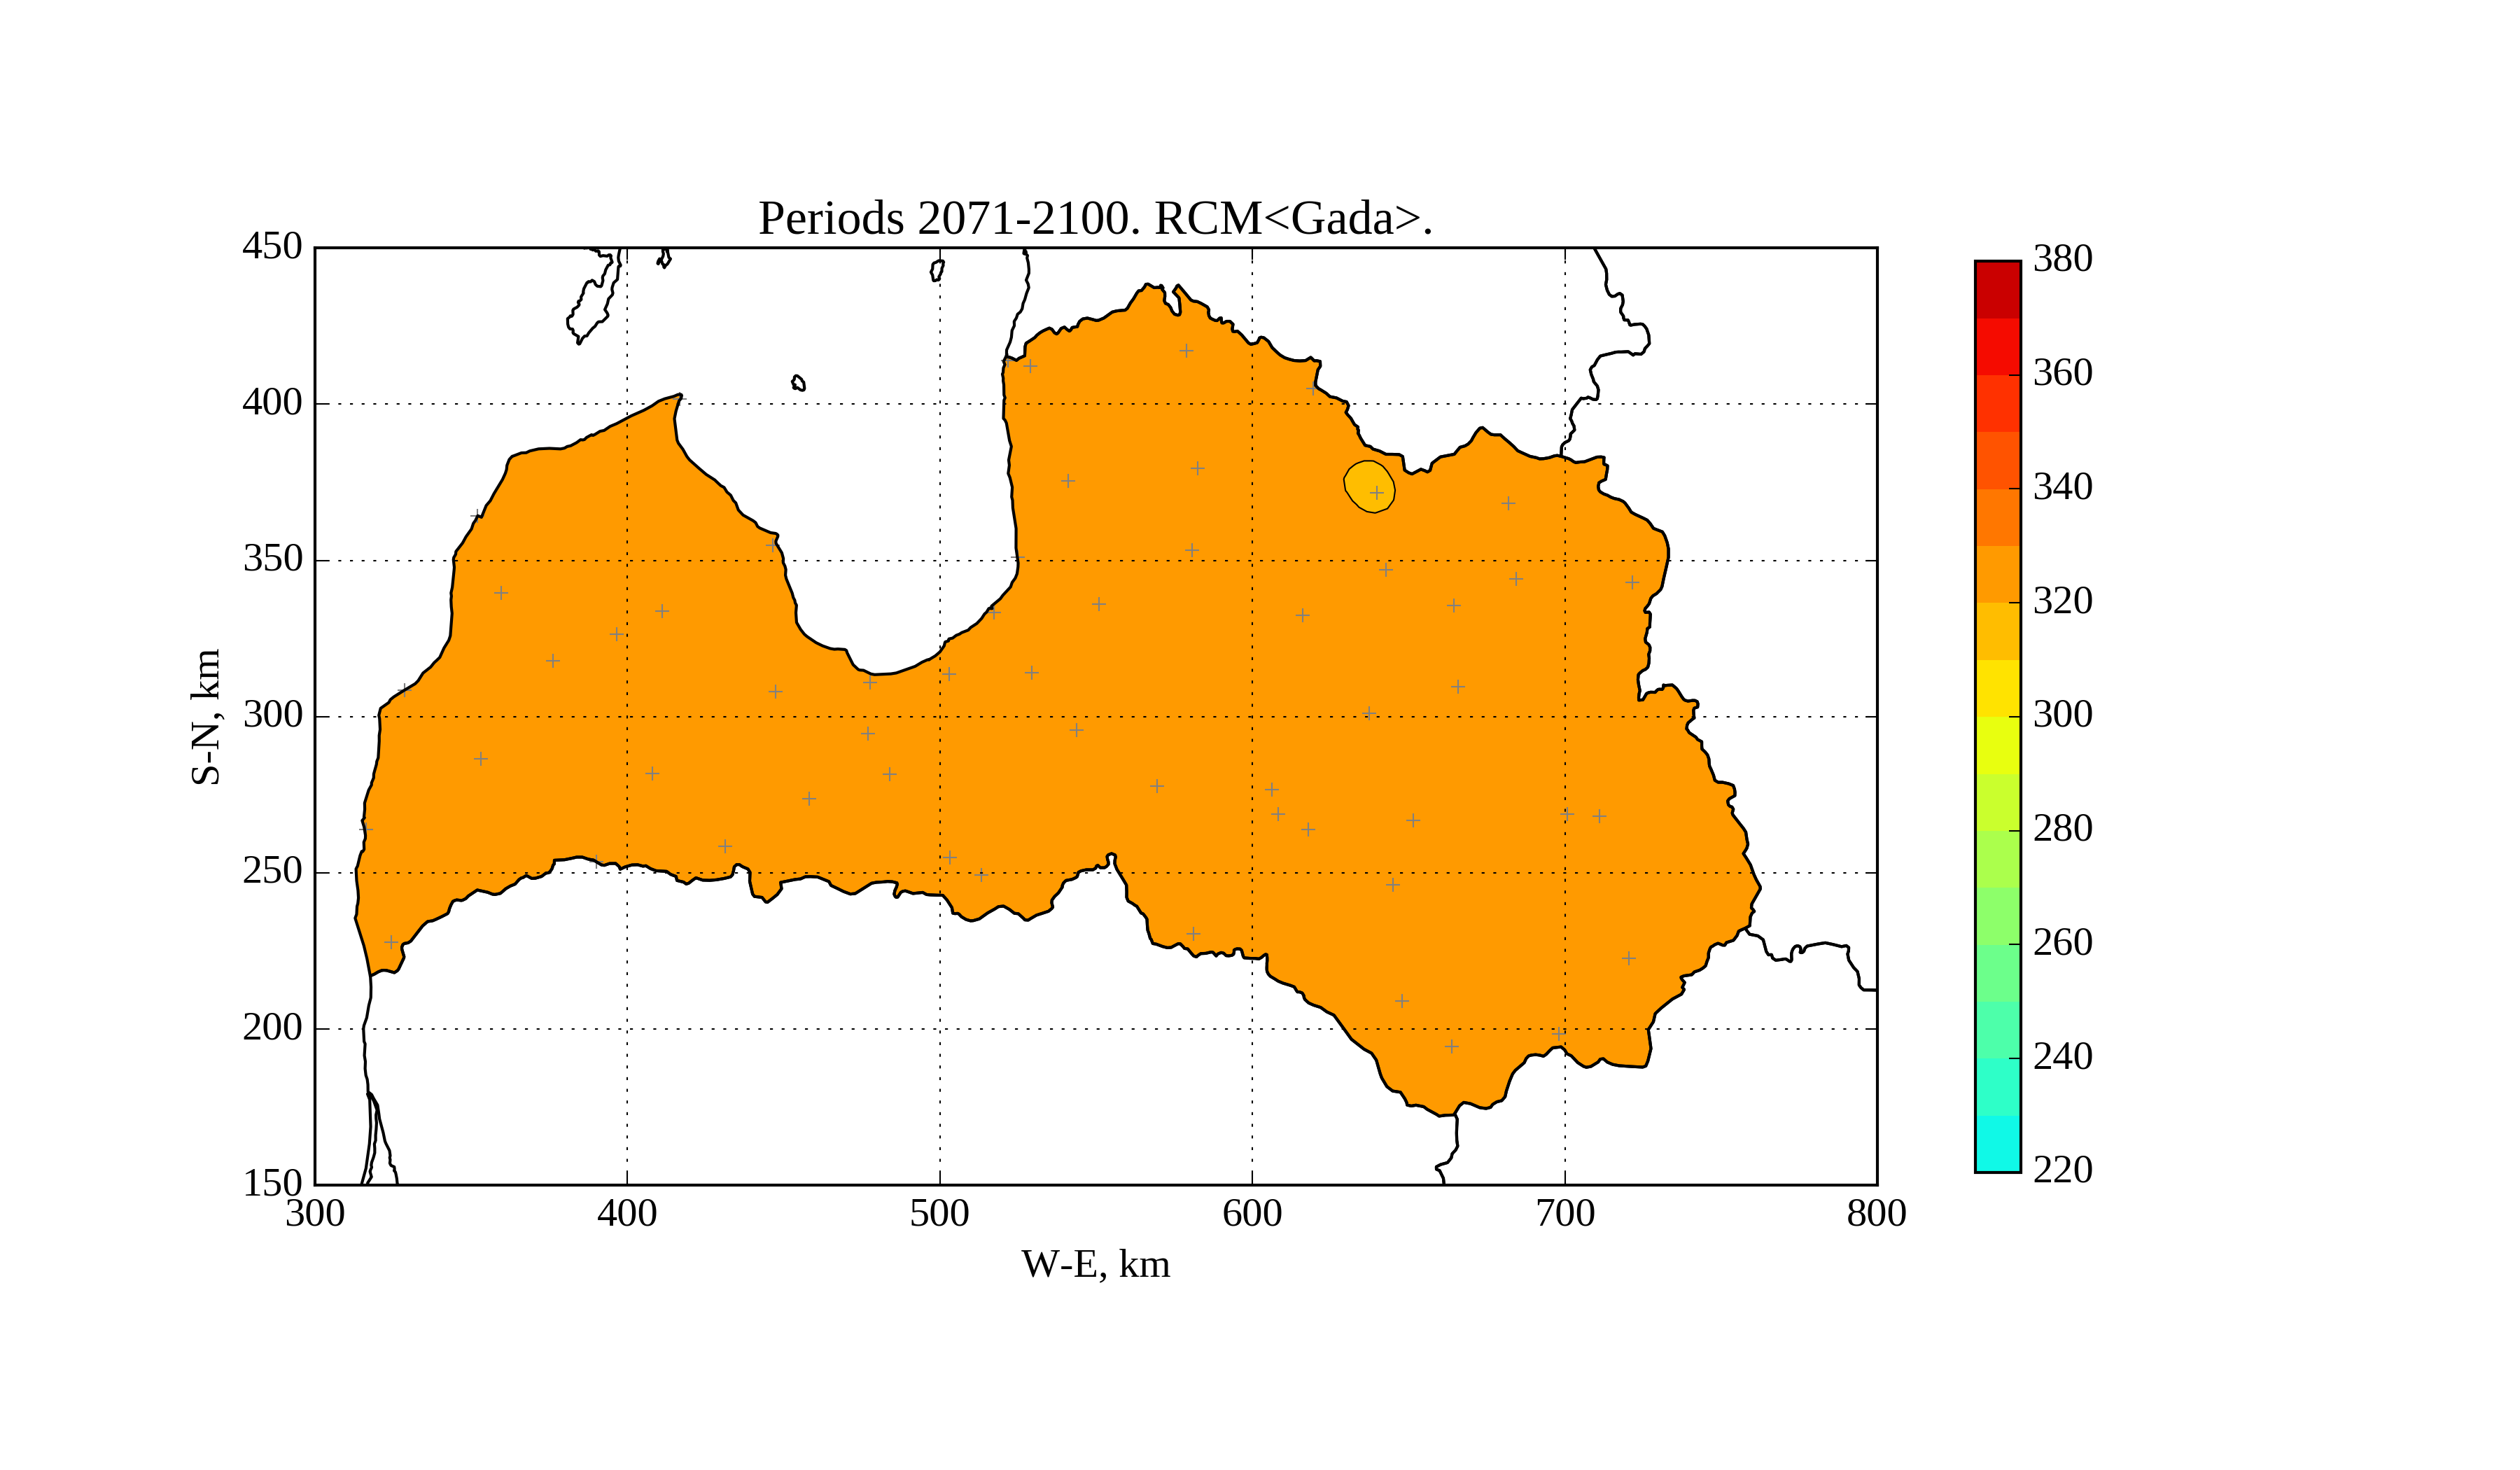
The difference of climatological trends betwean Latvian coast and inland can be seen also on maps, see Figures 15-18.
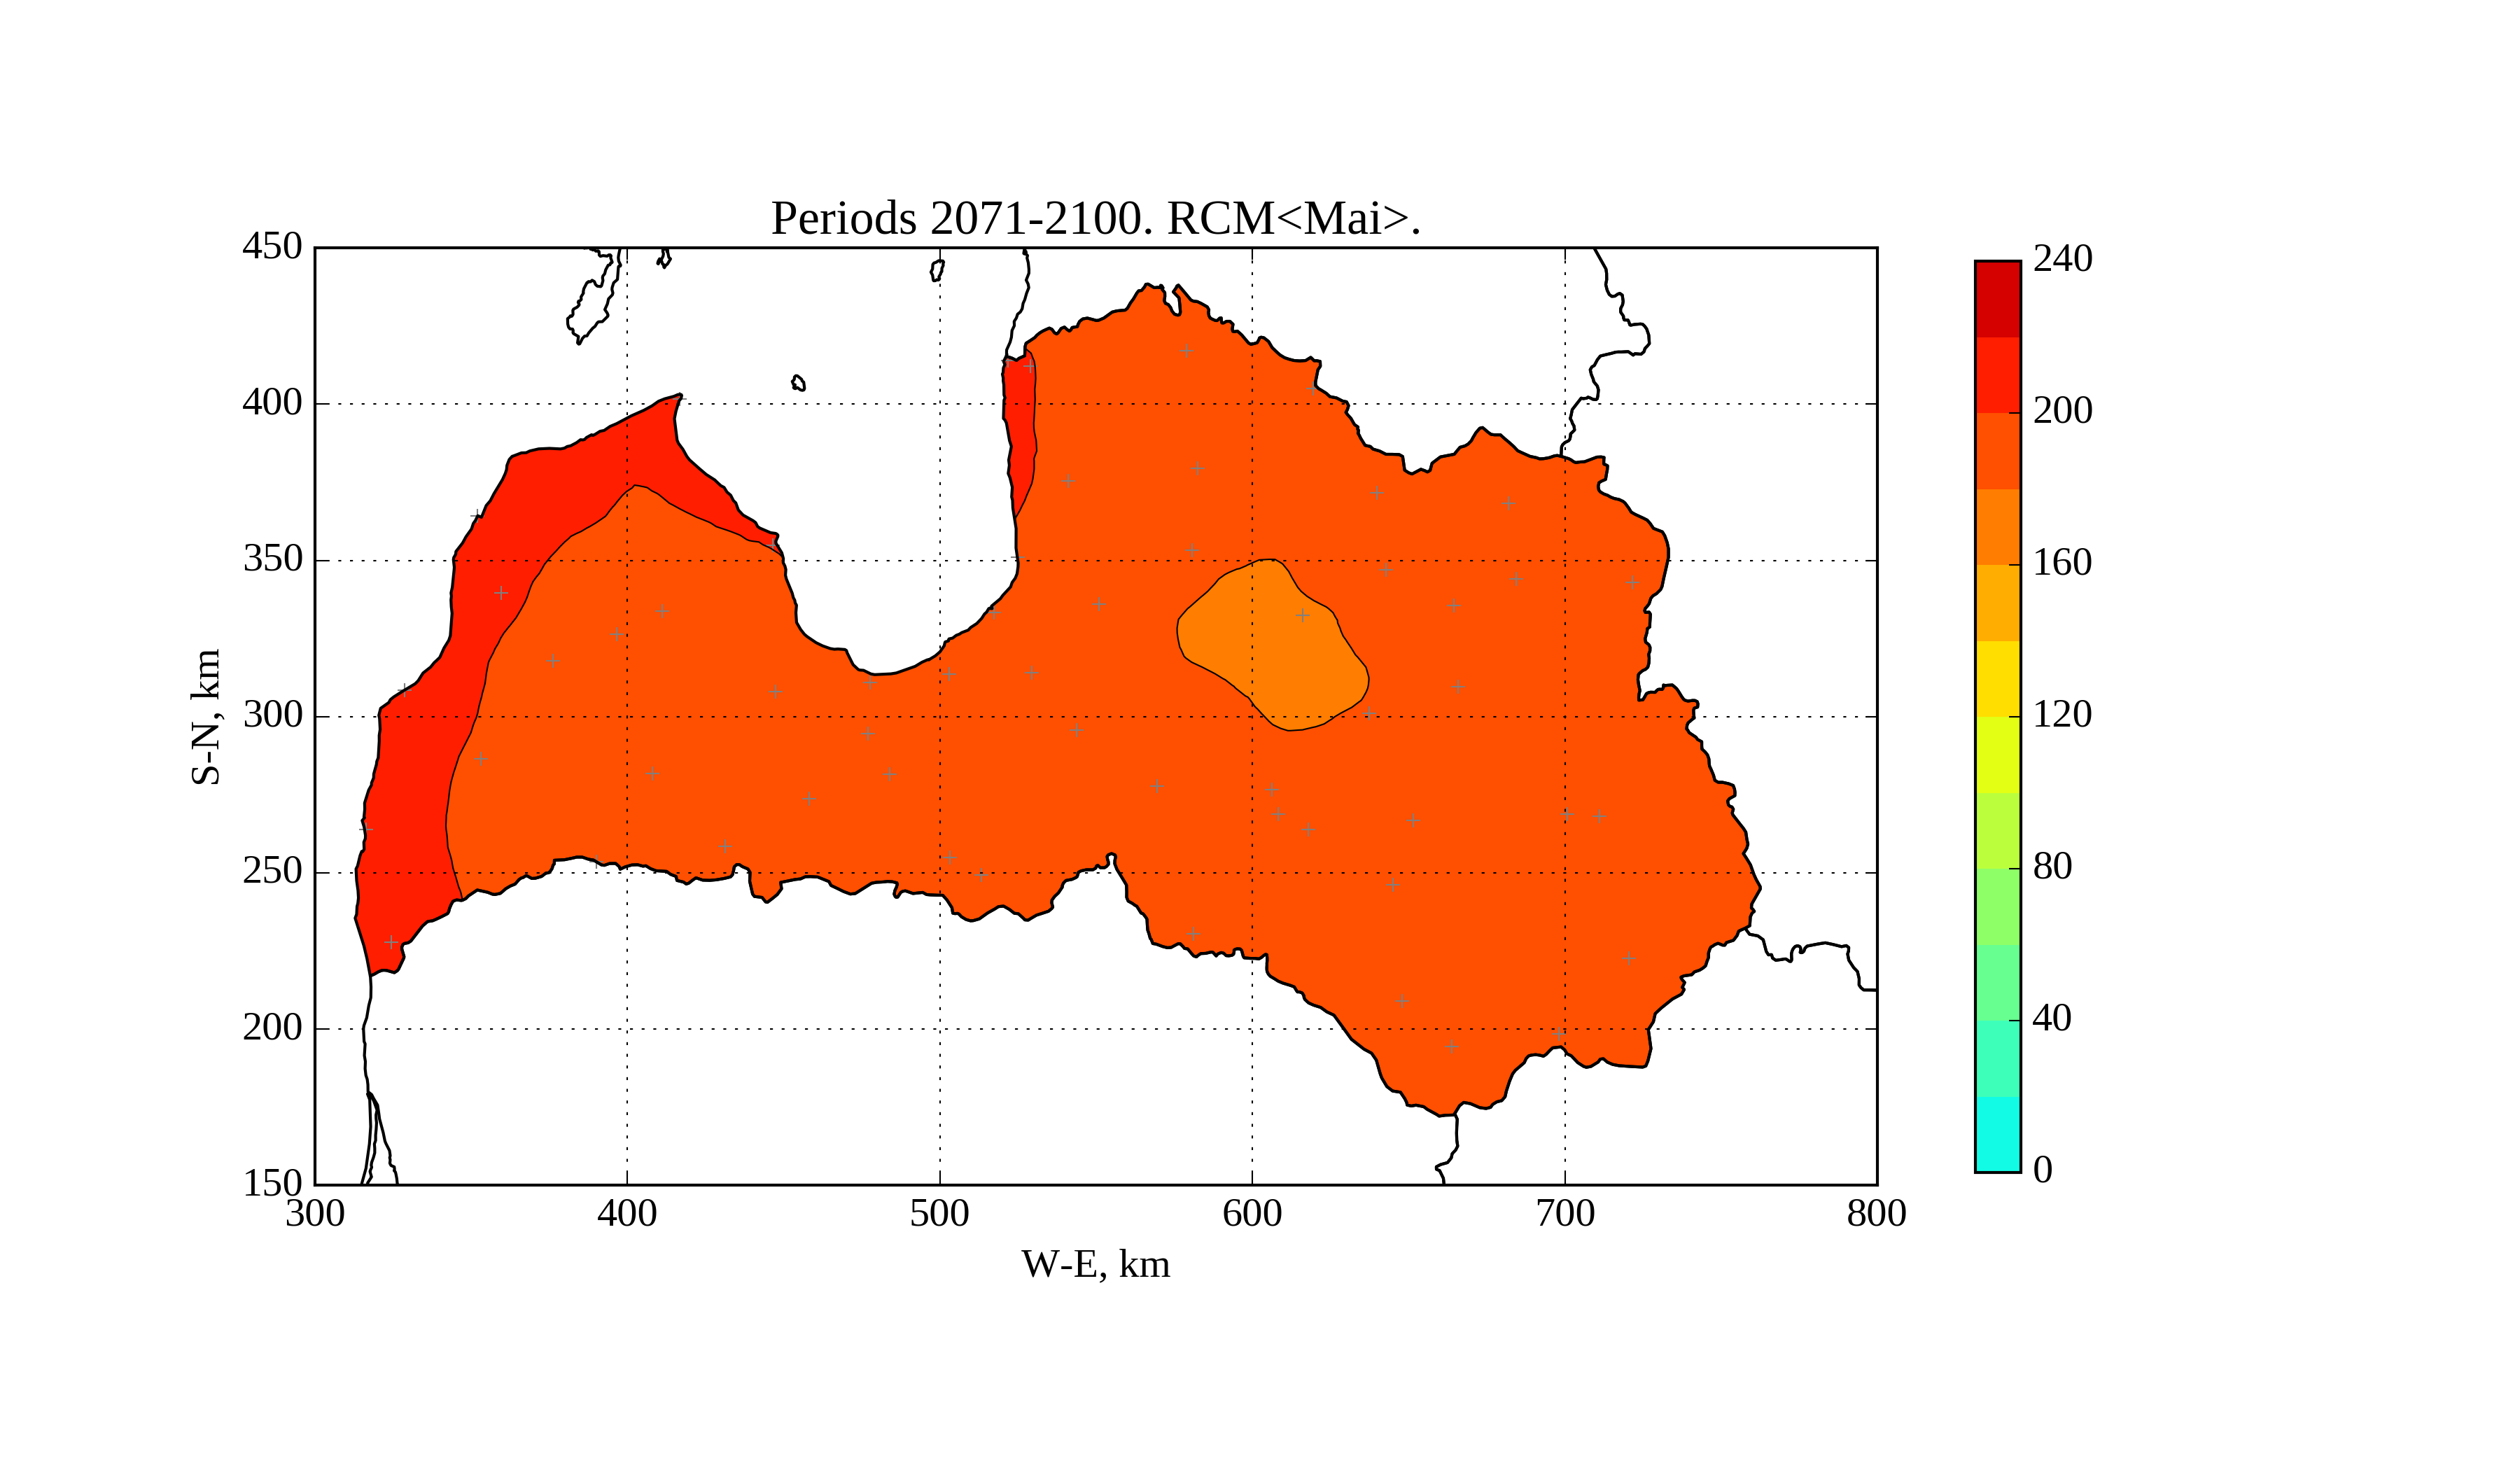
Figure 15. Average solar irradiation [W/m^2] on horizontal surface in May of period 1961-1990 according to RCM
Figure 16. Average solar irradiation [W/m^2] on horizontal surface in May of period 2071-2100 according to RCM
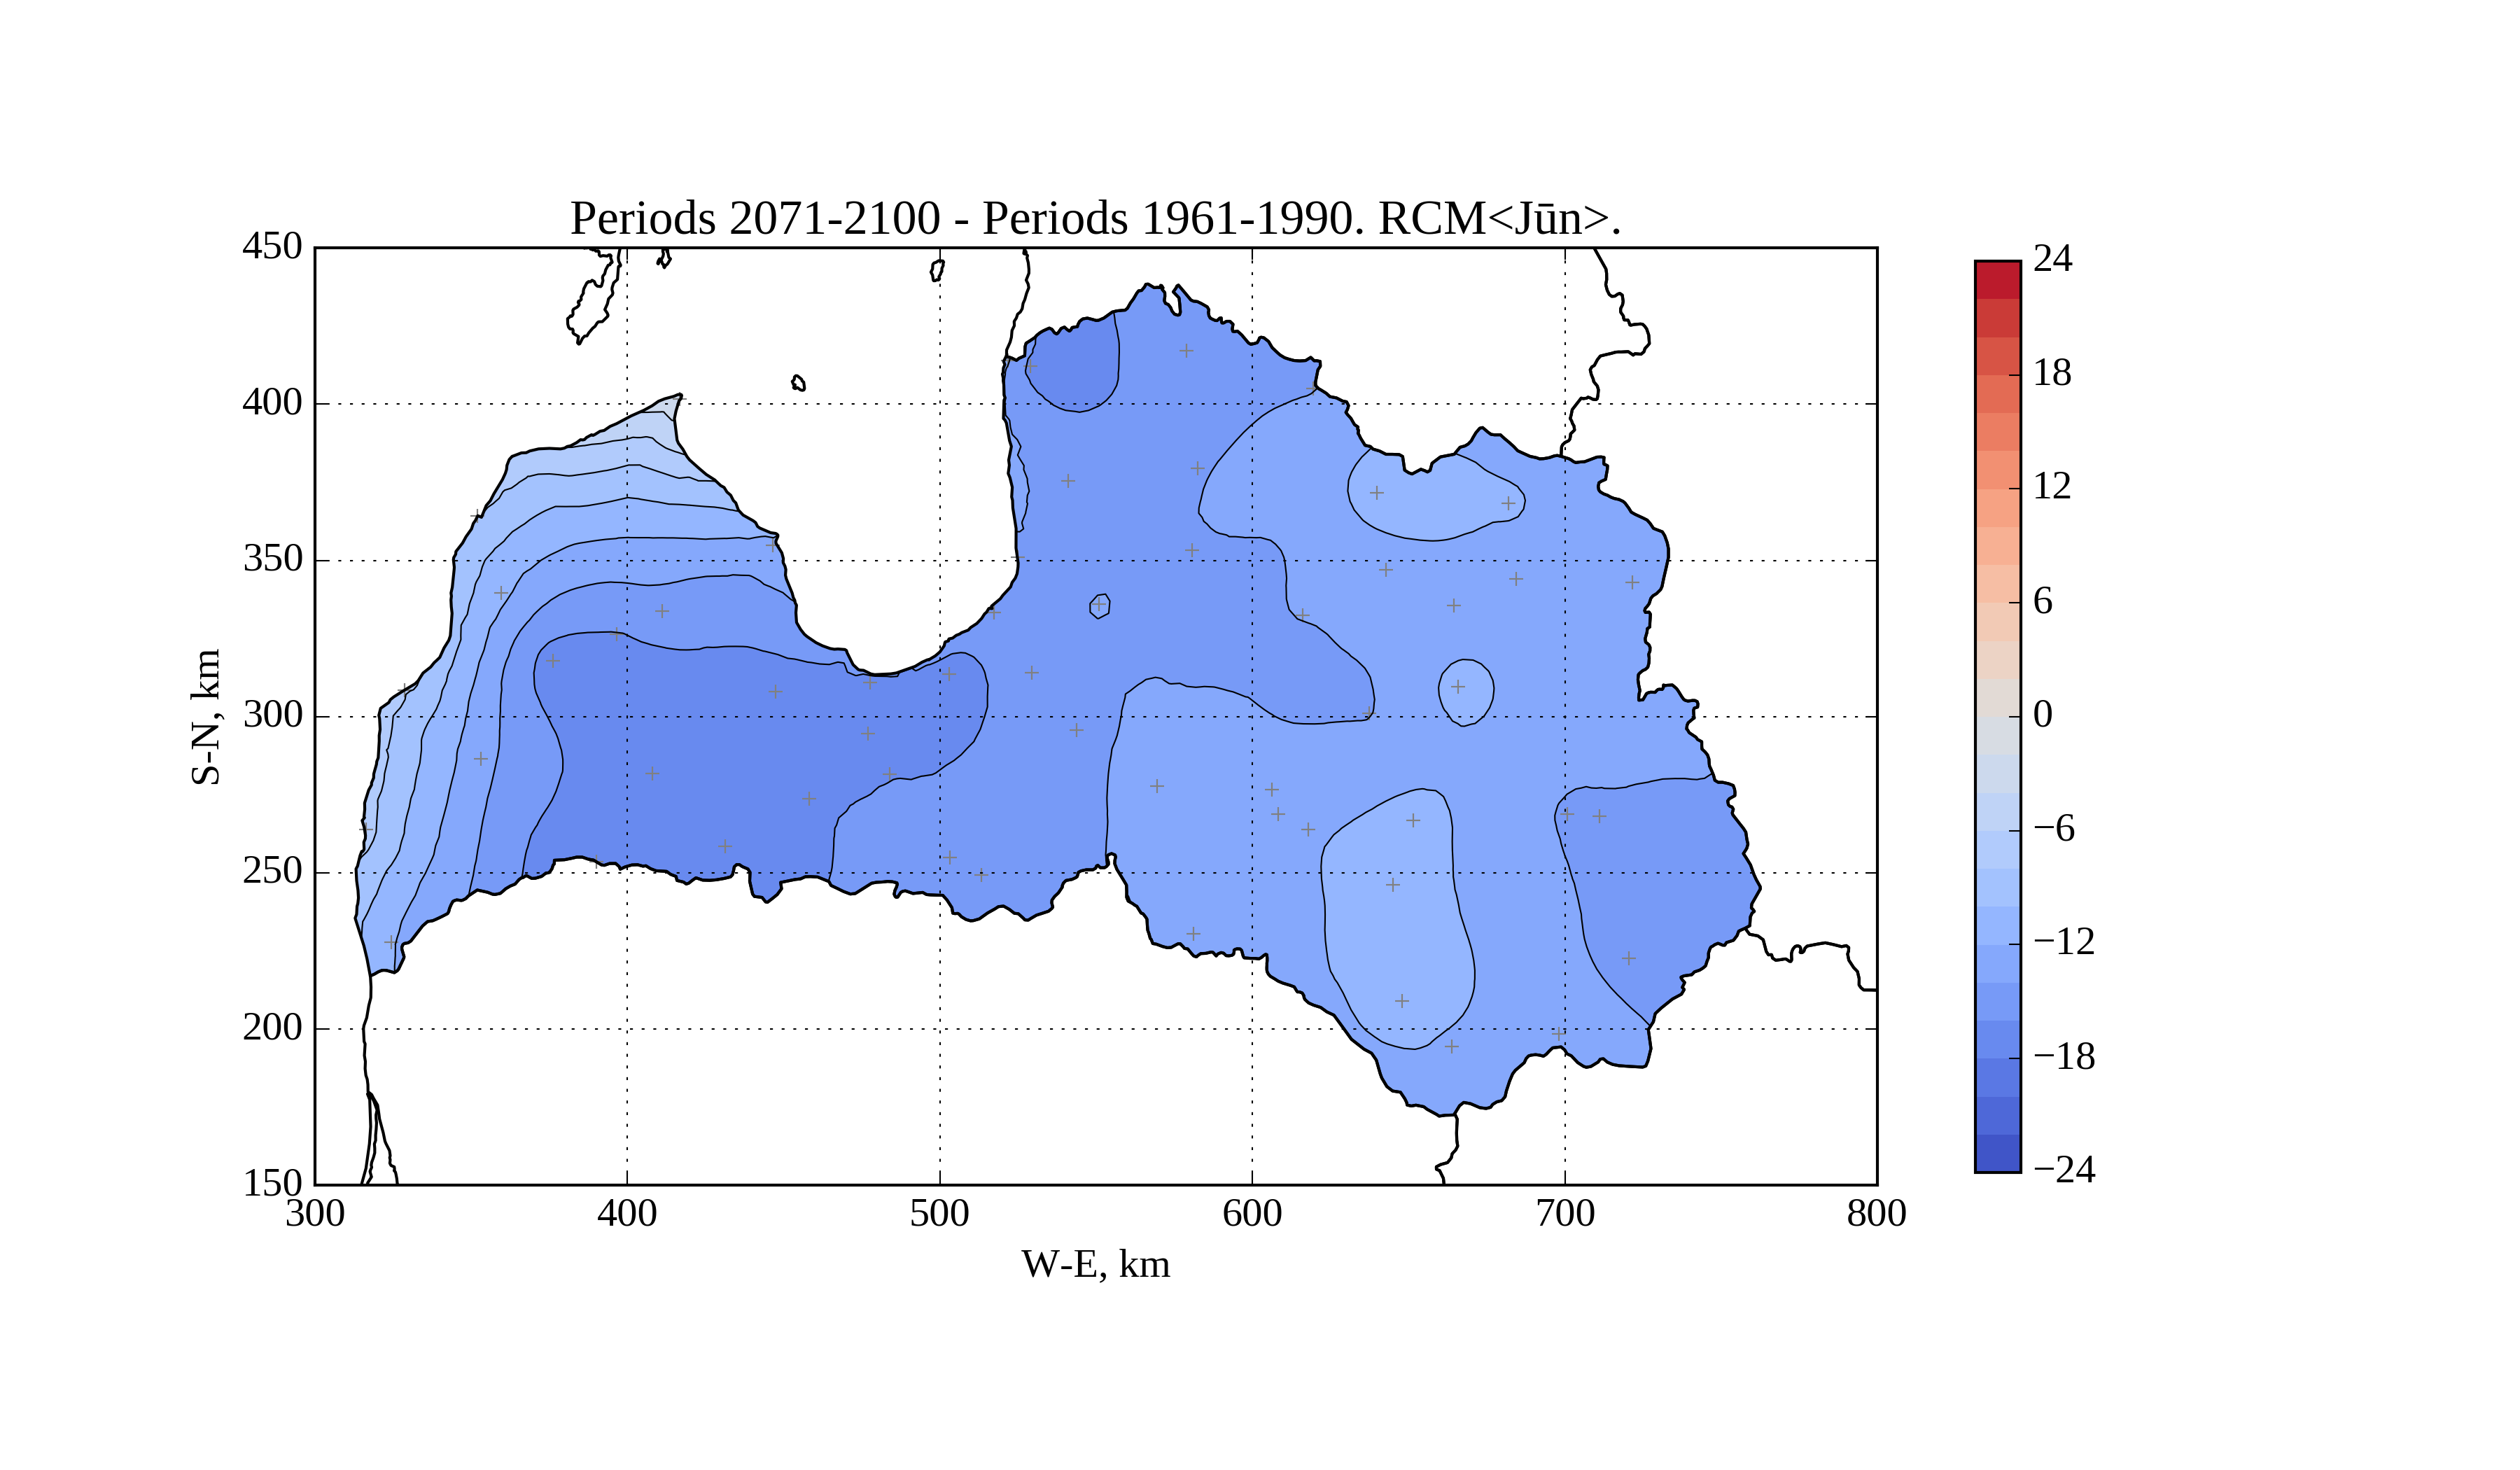
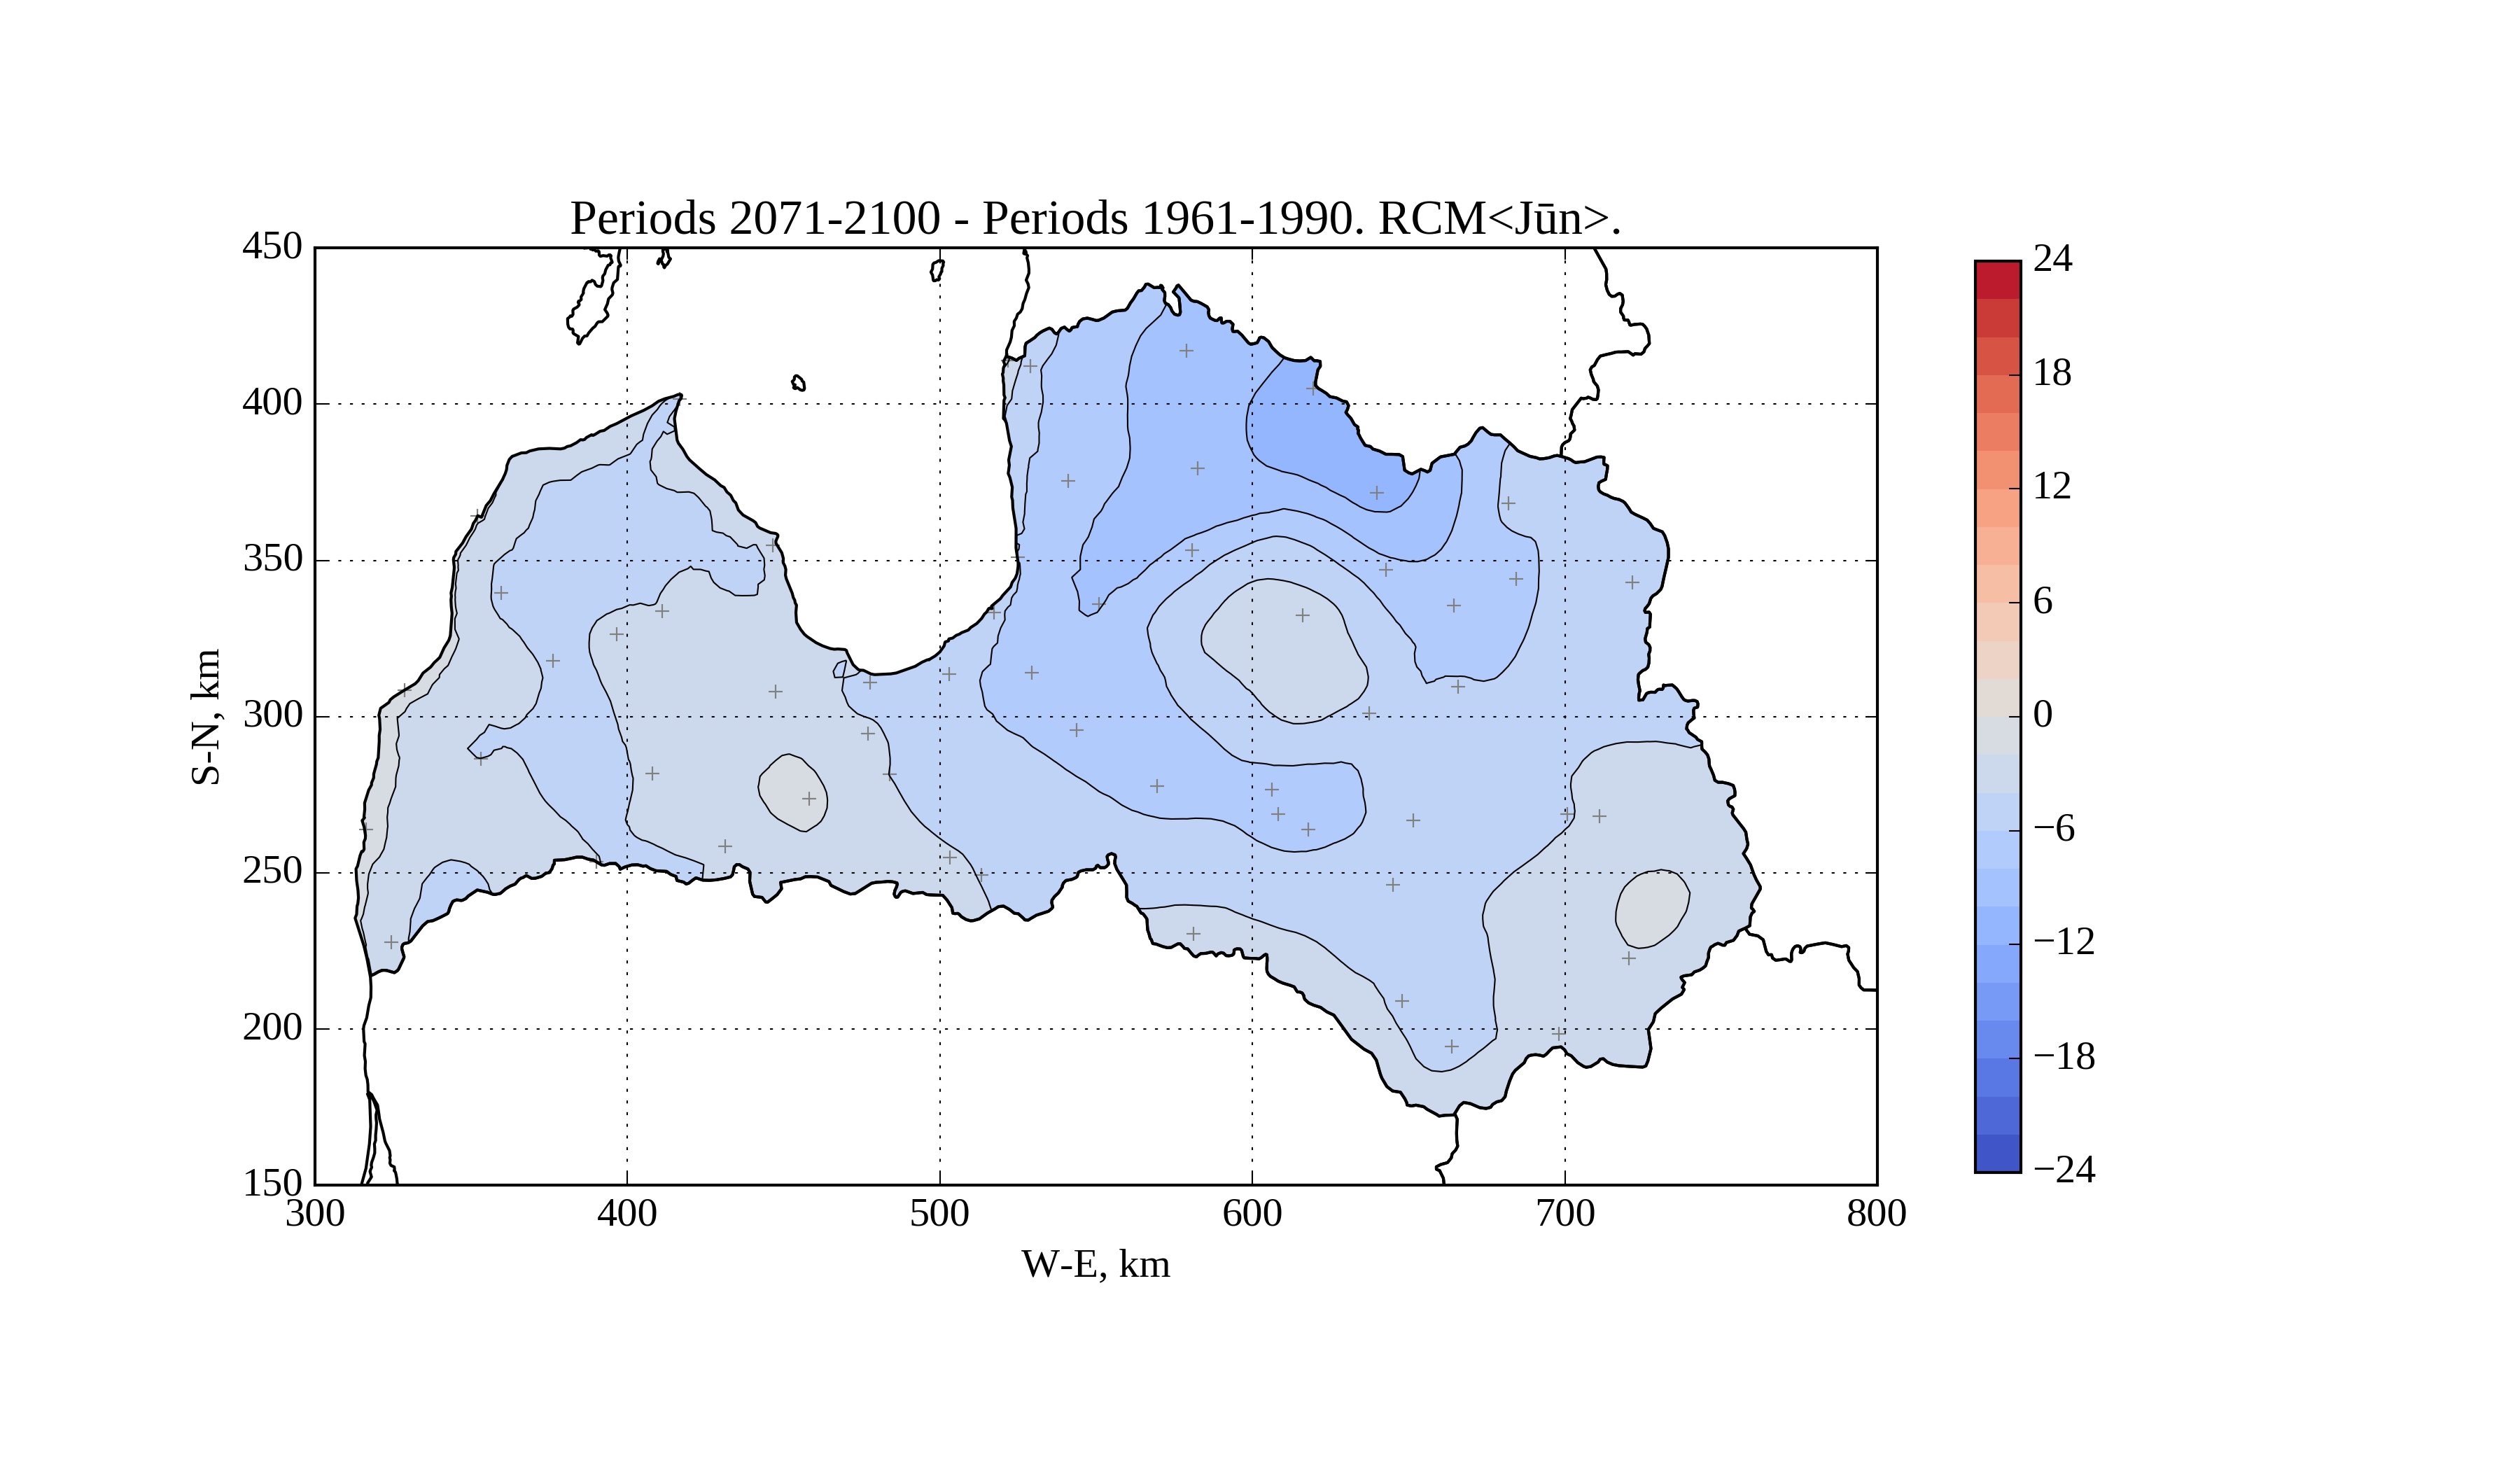
Figure 17. Change of average solar irradiation [W/m^2] on horizontal surface in June from period 1961-1990 to 2071-2100
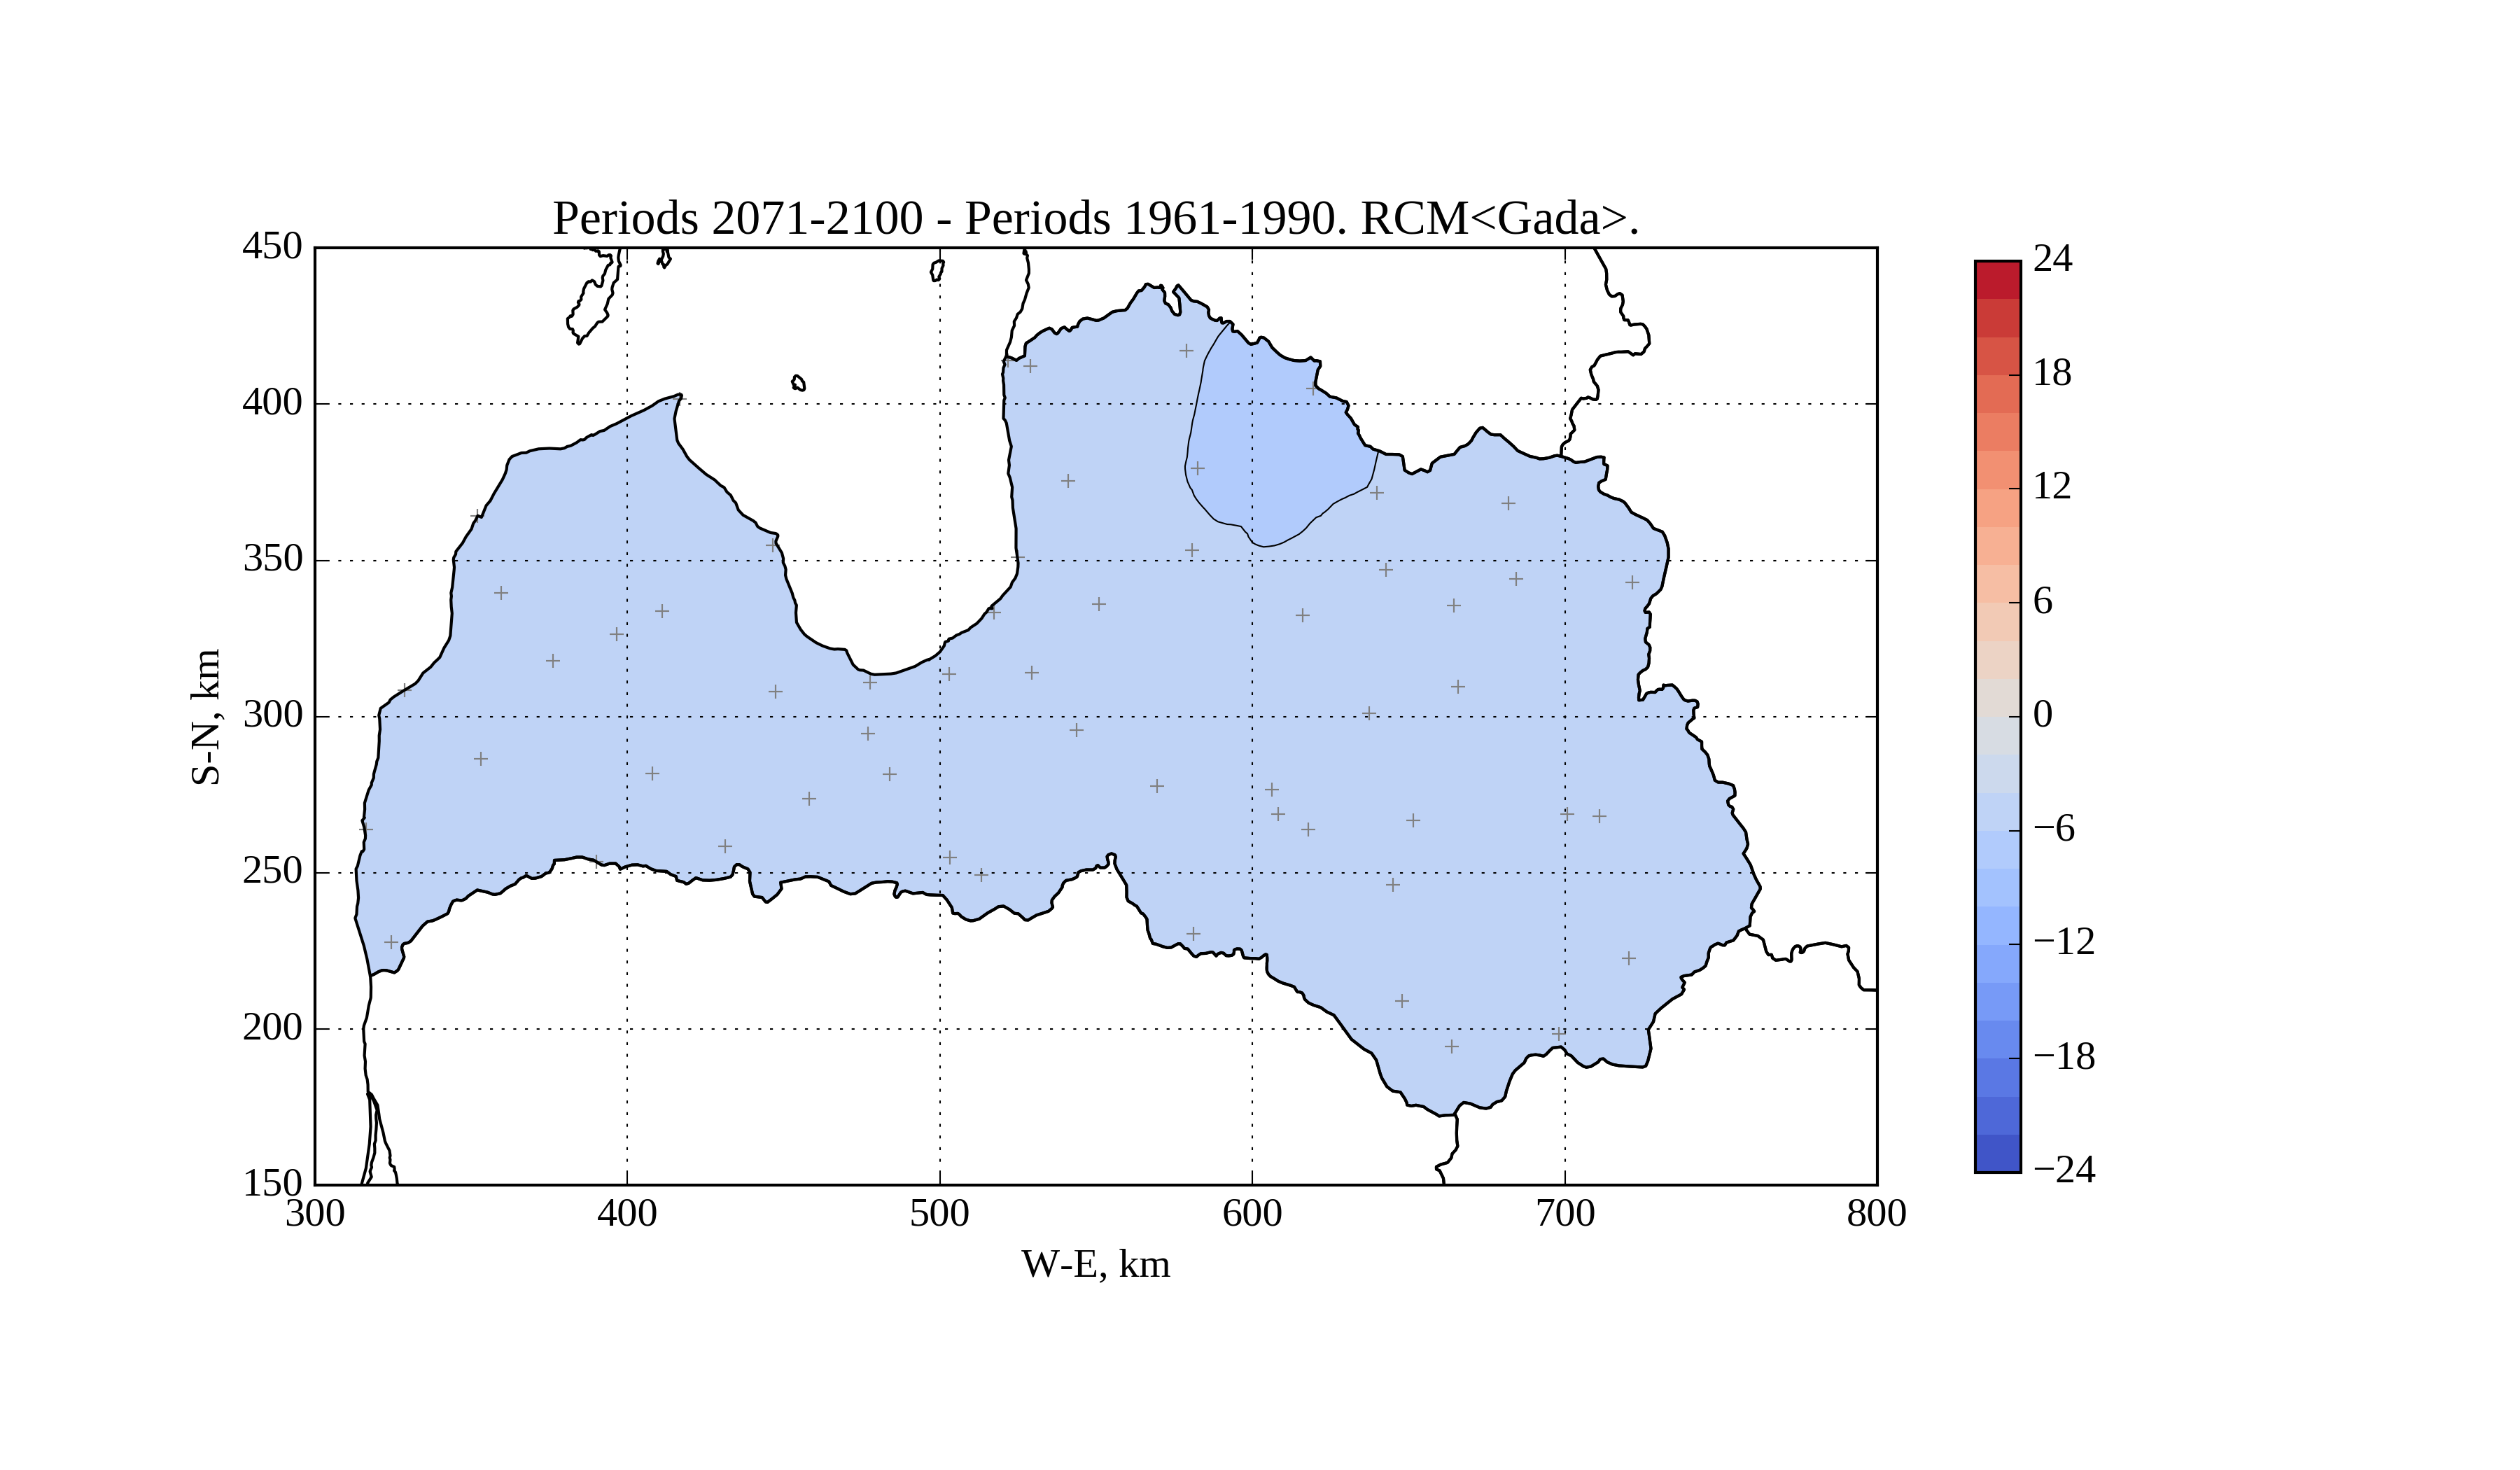
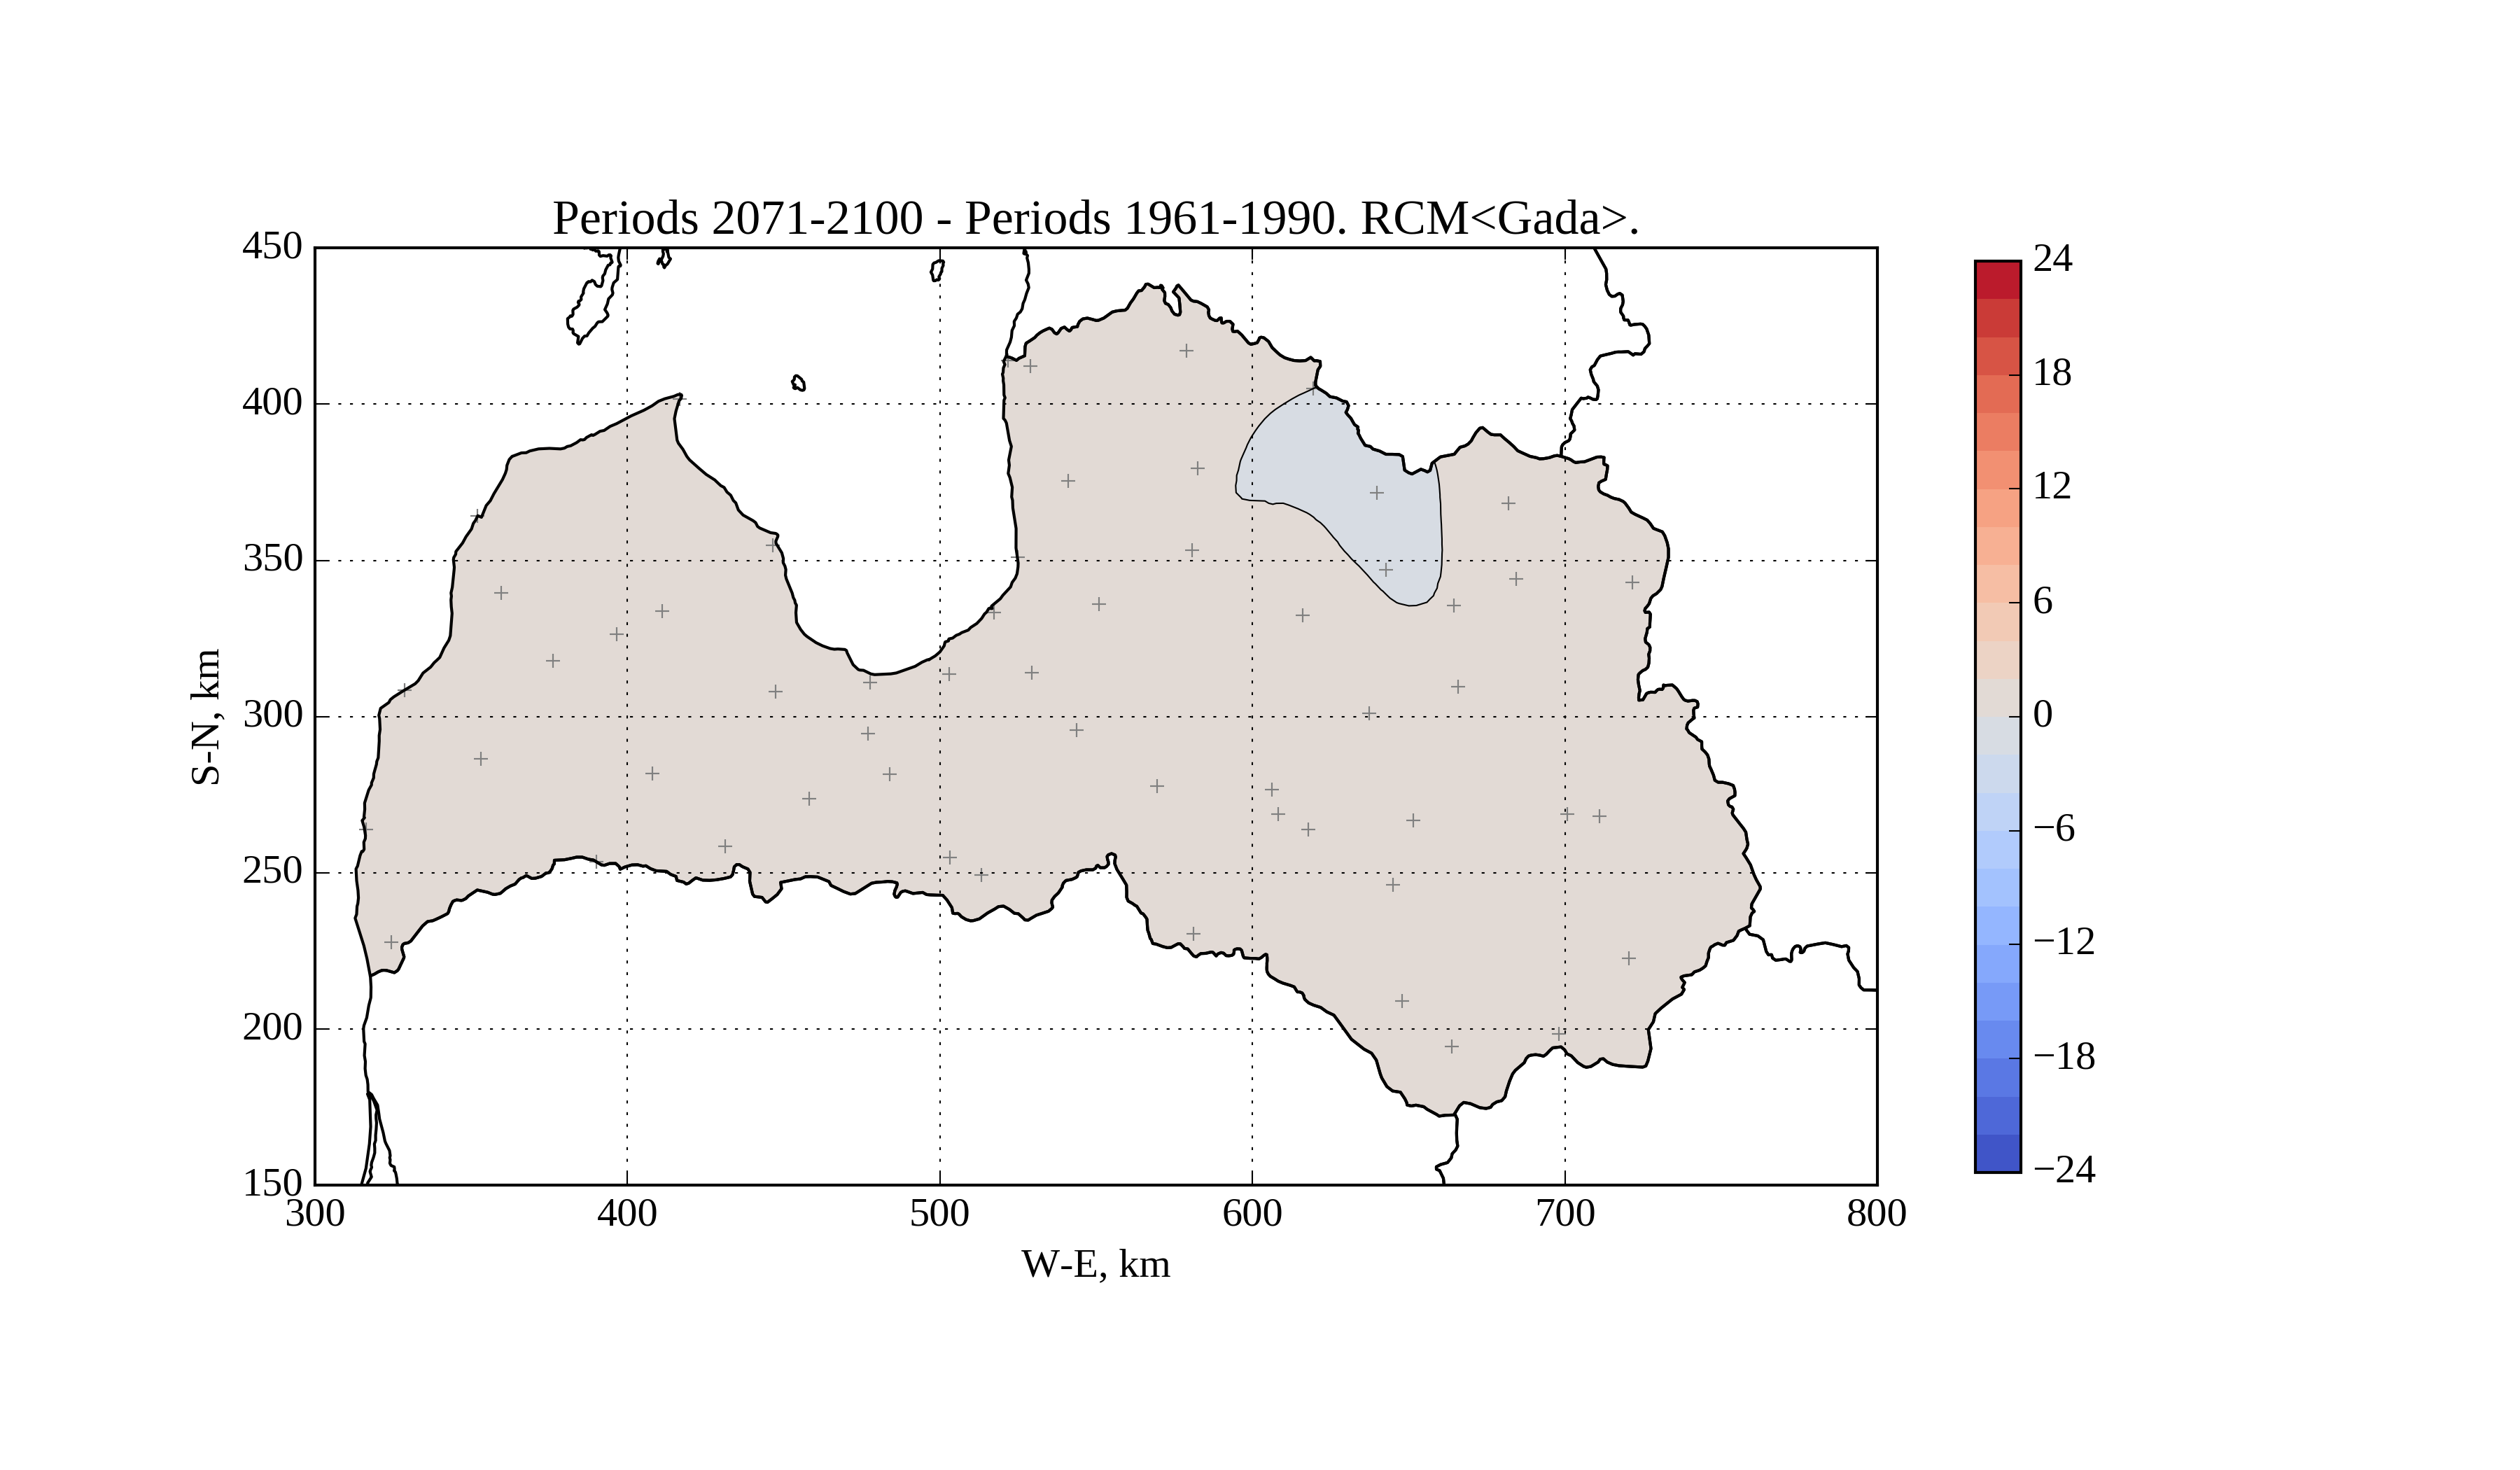
Figure 18. Change of yearly average solar irradiation [W/m^2] on horizontal surface from period 1961-1990 to 2071-2100
The figure suggest that coastal stations stay relatively unchanged, but land stations will experience slight decrease of solar irradiation.
The best placement of solar pannels seems to be at south-west corner of Latvia.
RCM with derived radiation from cloudiness
It is possible to estimate RCM model irradiation using the total cloud cover data in the same way as the irradiation data from observations are derived.
There is light tendency for solar irradiation to decrease according to median of derived RCM model irradition, too, see Figures 19-22. However, the trend is much lower.
Figure 19. Climatological trend of yearly average solar irradiation on horizontal surface in Kolka with derived RCM irradiation
Figure 20. Climatological trend of yearly average solar irradiation on horizontal surface in Aluksne with derived RCM irradiation
Figure 21. Climatological trend of yearly average solar irradiation on horizontal surface in Dobele with derived RCM irradiation
Figure 22. Climatological trend of yearly average solar irradiation on horizontal surface in Daugavpils with derived RCM irradiation
Now consider the climatological trend in montly distribution of solar radiation in case of derived RCM irradiation, see Figures 23-26.
Figure 23. Monthly solar irradiation on horizontal surface for different climatological periods in Kolka with derived RCM irradiation
Figure 24. Monthly solar irradiation on horizontal surface for different climatological periods in Aluksne with derived RCM irradiation
Figure 25. Monthly solar irradiation on horizontal surface for different climatological periods in Dobele with derived RCM irradiation
Figure 26. Monthly solar irradiation on horizontal surface for different climatological periods in Daugavpils with derived RCM irradiation
All stations have similar trend of monthly distribution of solar irradiation, not just land stations as with direct RCM irradiation.
Difference between climatological periods is relatively weak.
Large difference of climatological trends betwean Latvian coast and inland cannot be seen on maps with dervied RCM irradiation, see Figures 27-30.
Figure 27. Average solar irradiation [W/m^2] on horizontal surface in May of period 1961-1990 according to derived RCM irradiation
Figure 28. Average solar irradiation [W/m^2] on horizontal surface in May of period 2071-2100 according to derived RCM irradiation
Figure 29. Change of average solar irradiation [W/m^2] on horizontal surface in June from period 1961-1990 to 2071-2100 according to derived RCM irradiation
Figure 30. Change of yearly average solar irradiation [W/m^2] on horizontal surface from period 1961-1990 to 2071-2100 according to derived RCM irradiation
The figure suggest that coastal stations and land stations behave relatively similar. Therefore, the coastal gradient in direct RCM irradiation looks suspicious.
Long wave radiation
RCM provides also downward Long Wave radiation data. It would be interesting to see the climatological trends to this long wave radiation.
Downward long wave radiation comes primarily from the atmosphere with major contribution from clouds.
There are no historical data of long wave radiation in Latvia, so we have to derive the quantity from available observed parameters.
The basic origin of long wave ration is heat radiation described by Stefann-Boltzmann law, where radiation intensity is proportional to source temperature expressed in Kelvins rised in power of 4.
It is hard to now exactly the temperature of the clouds.
However, we can assume that there is nearly quasi-static heat balance between upward heat radiation from the earth surface and downward heat radiation from the clouds.
Thus, we need to know the earth temperature. It is approximately equal with air temperature near the earth surface.
The comparison with radiation data suggests that empirical formula for lon wave radiation: 300*((t+273.15)/273.15)^4*C^(1/8) works well,
where t is air temperature at the ground in Celsius and C is total cloud cover.
Presence of cloud cover factor comes in because the absence of clouds will reduce the downward long wave radiation.
The power constant, however, is small because absence of clouds also reduces earth temperature in night or winter conditions.
As the cloudiness tends to increase in last decades, then we can expect slight increase of long wave radiation. Figures 31-35 suggest that it is definetely so.
Figure 31. Climatological trend of yearly average LW irradiation on horizontal surface in Kolka
Figure 32. Climatological trend of yearly average LW irradiation on horizontal surface in Aluksne
Figure 33. Climatological trend of yearly average LW irradiation on horizontal surface in Dobele
Figure 34. Climatological trend of yearly average LW irradiation on horizontal surface in Daugavpils
Primary reason of upward trend is increase of average air temperature. The other reason is slight increase in cloudiness.
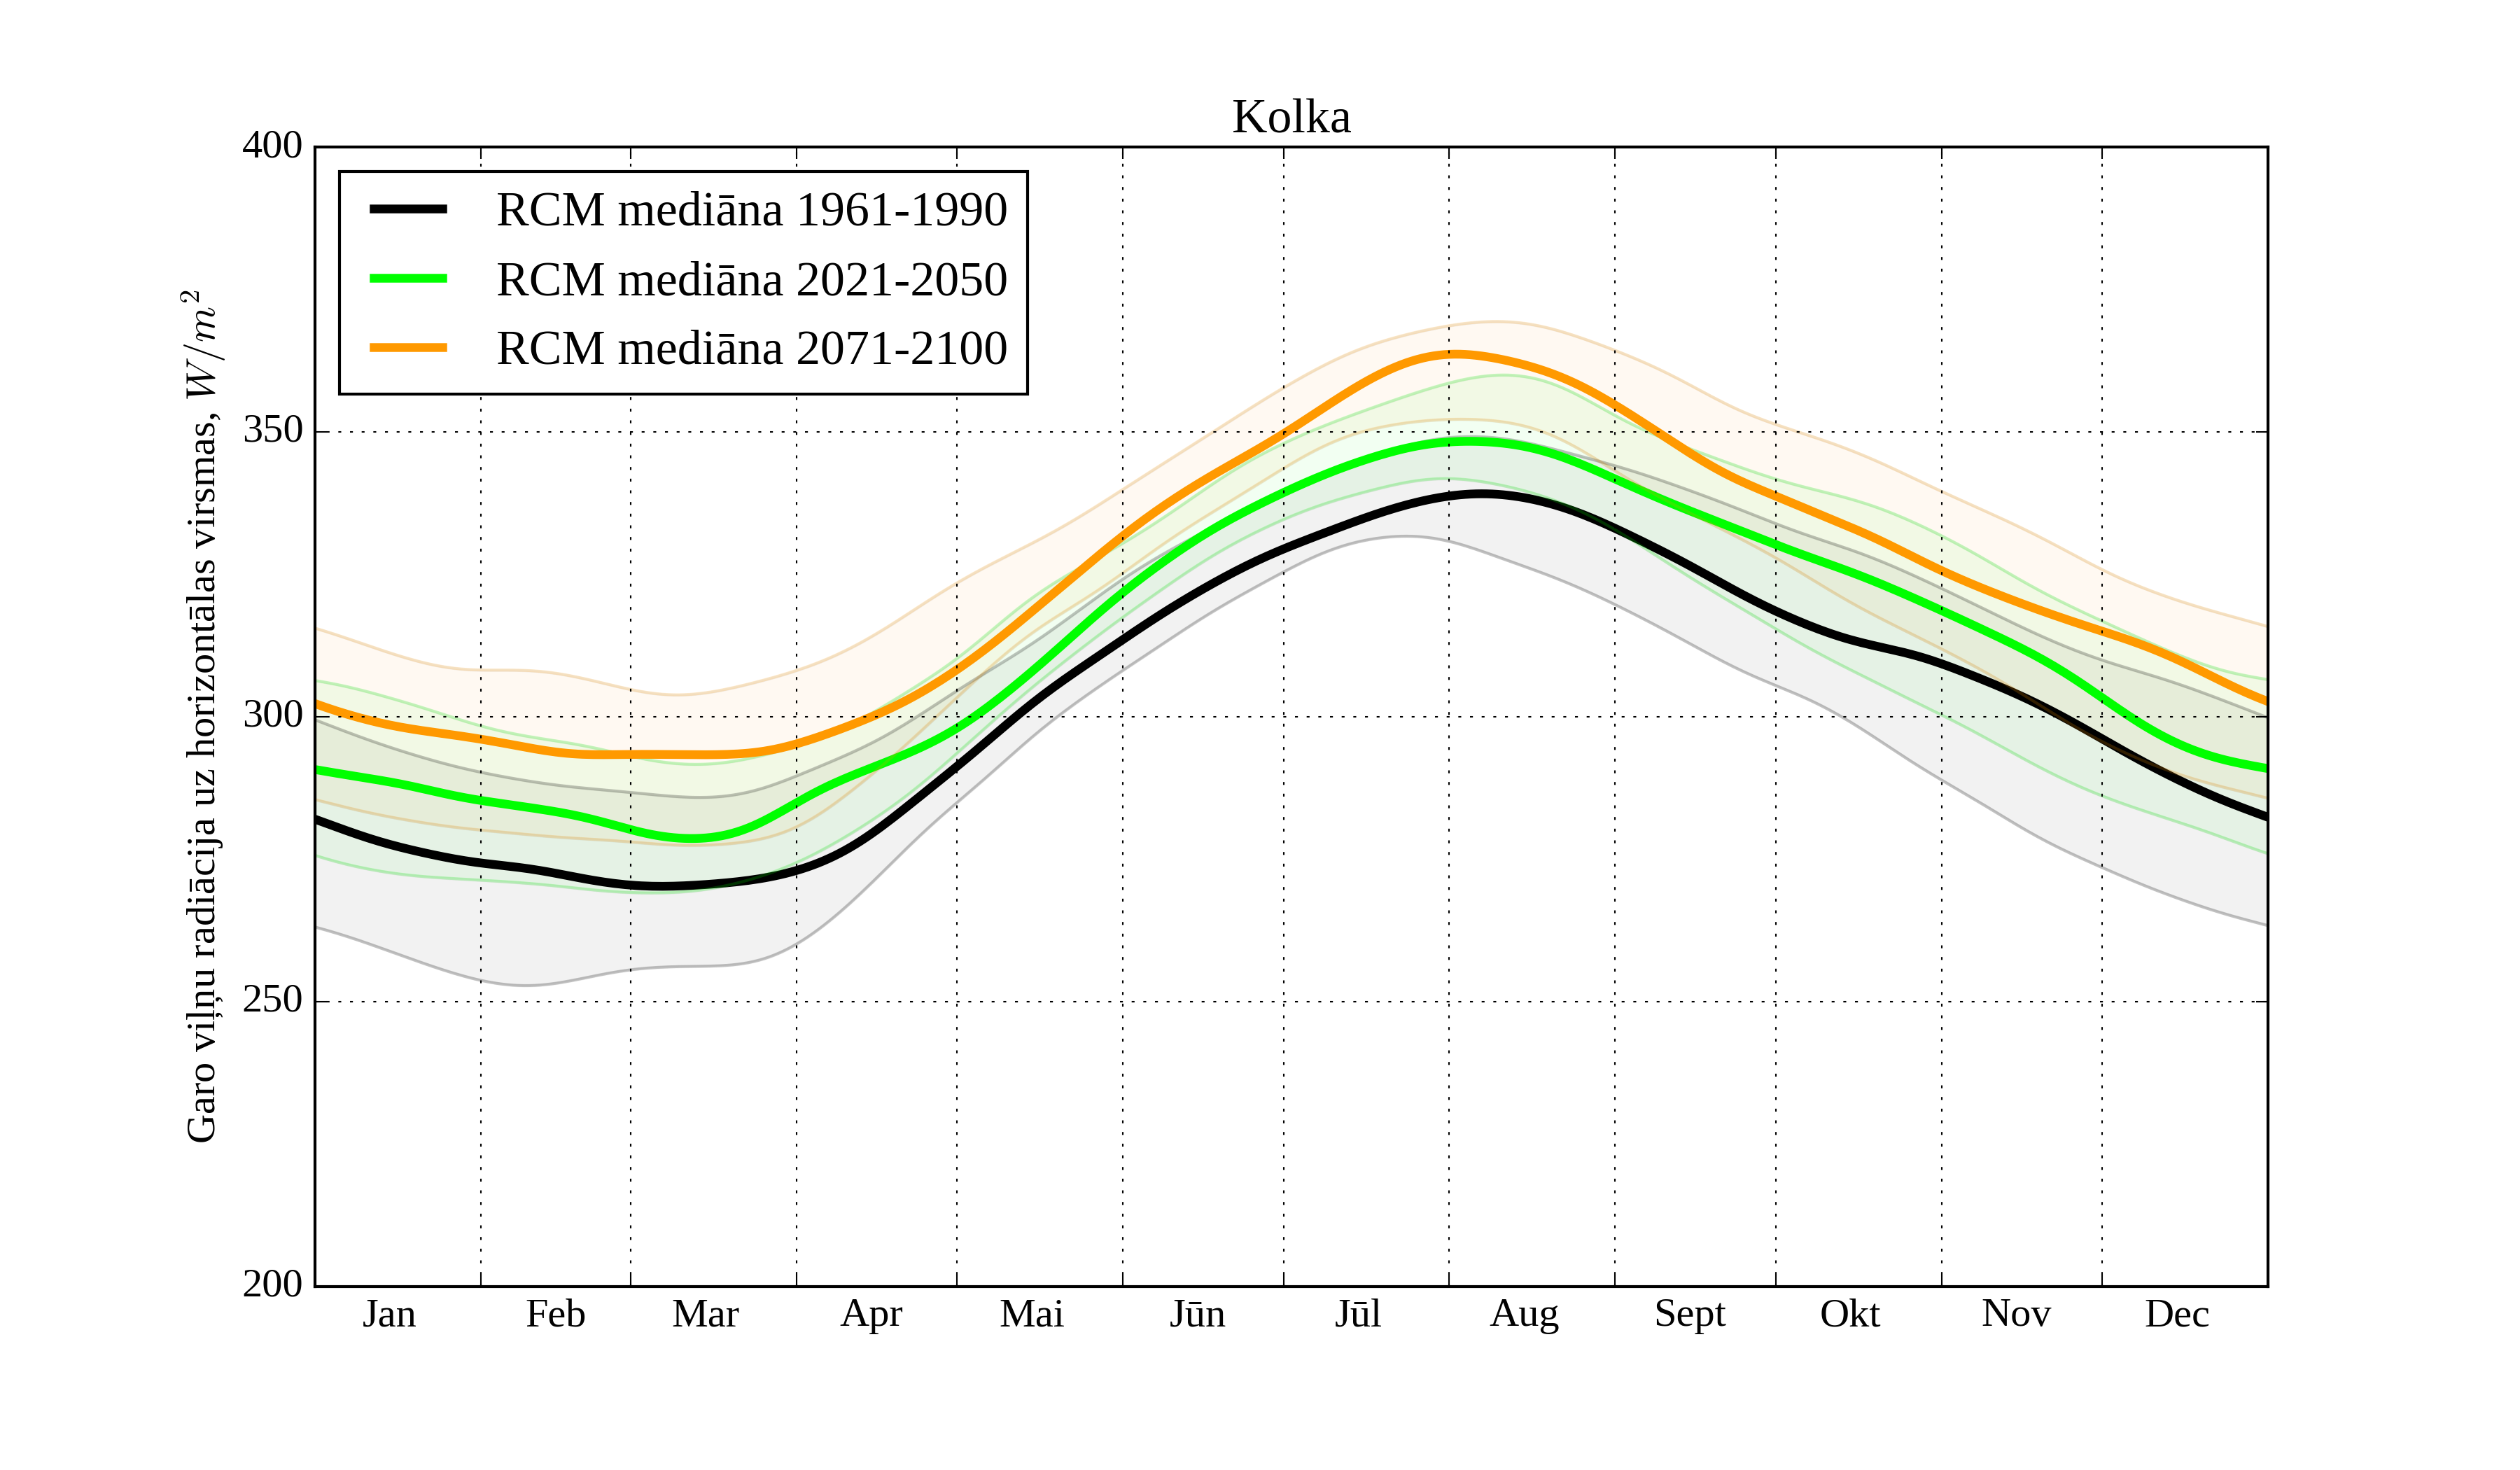
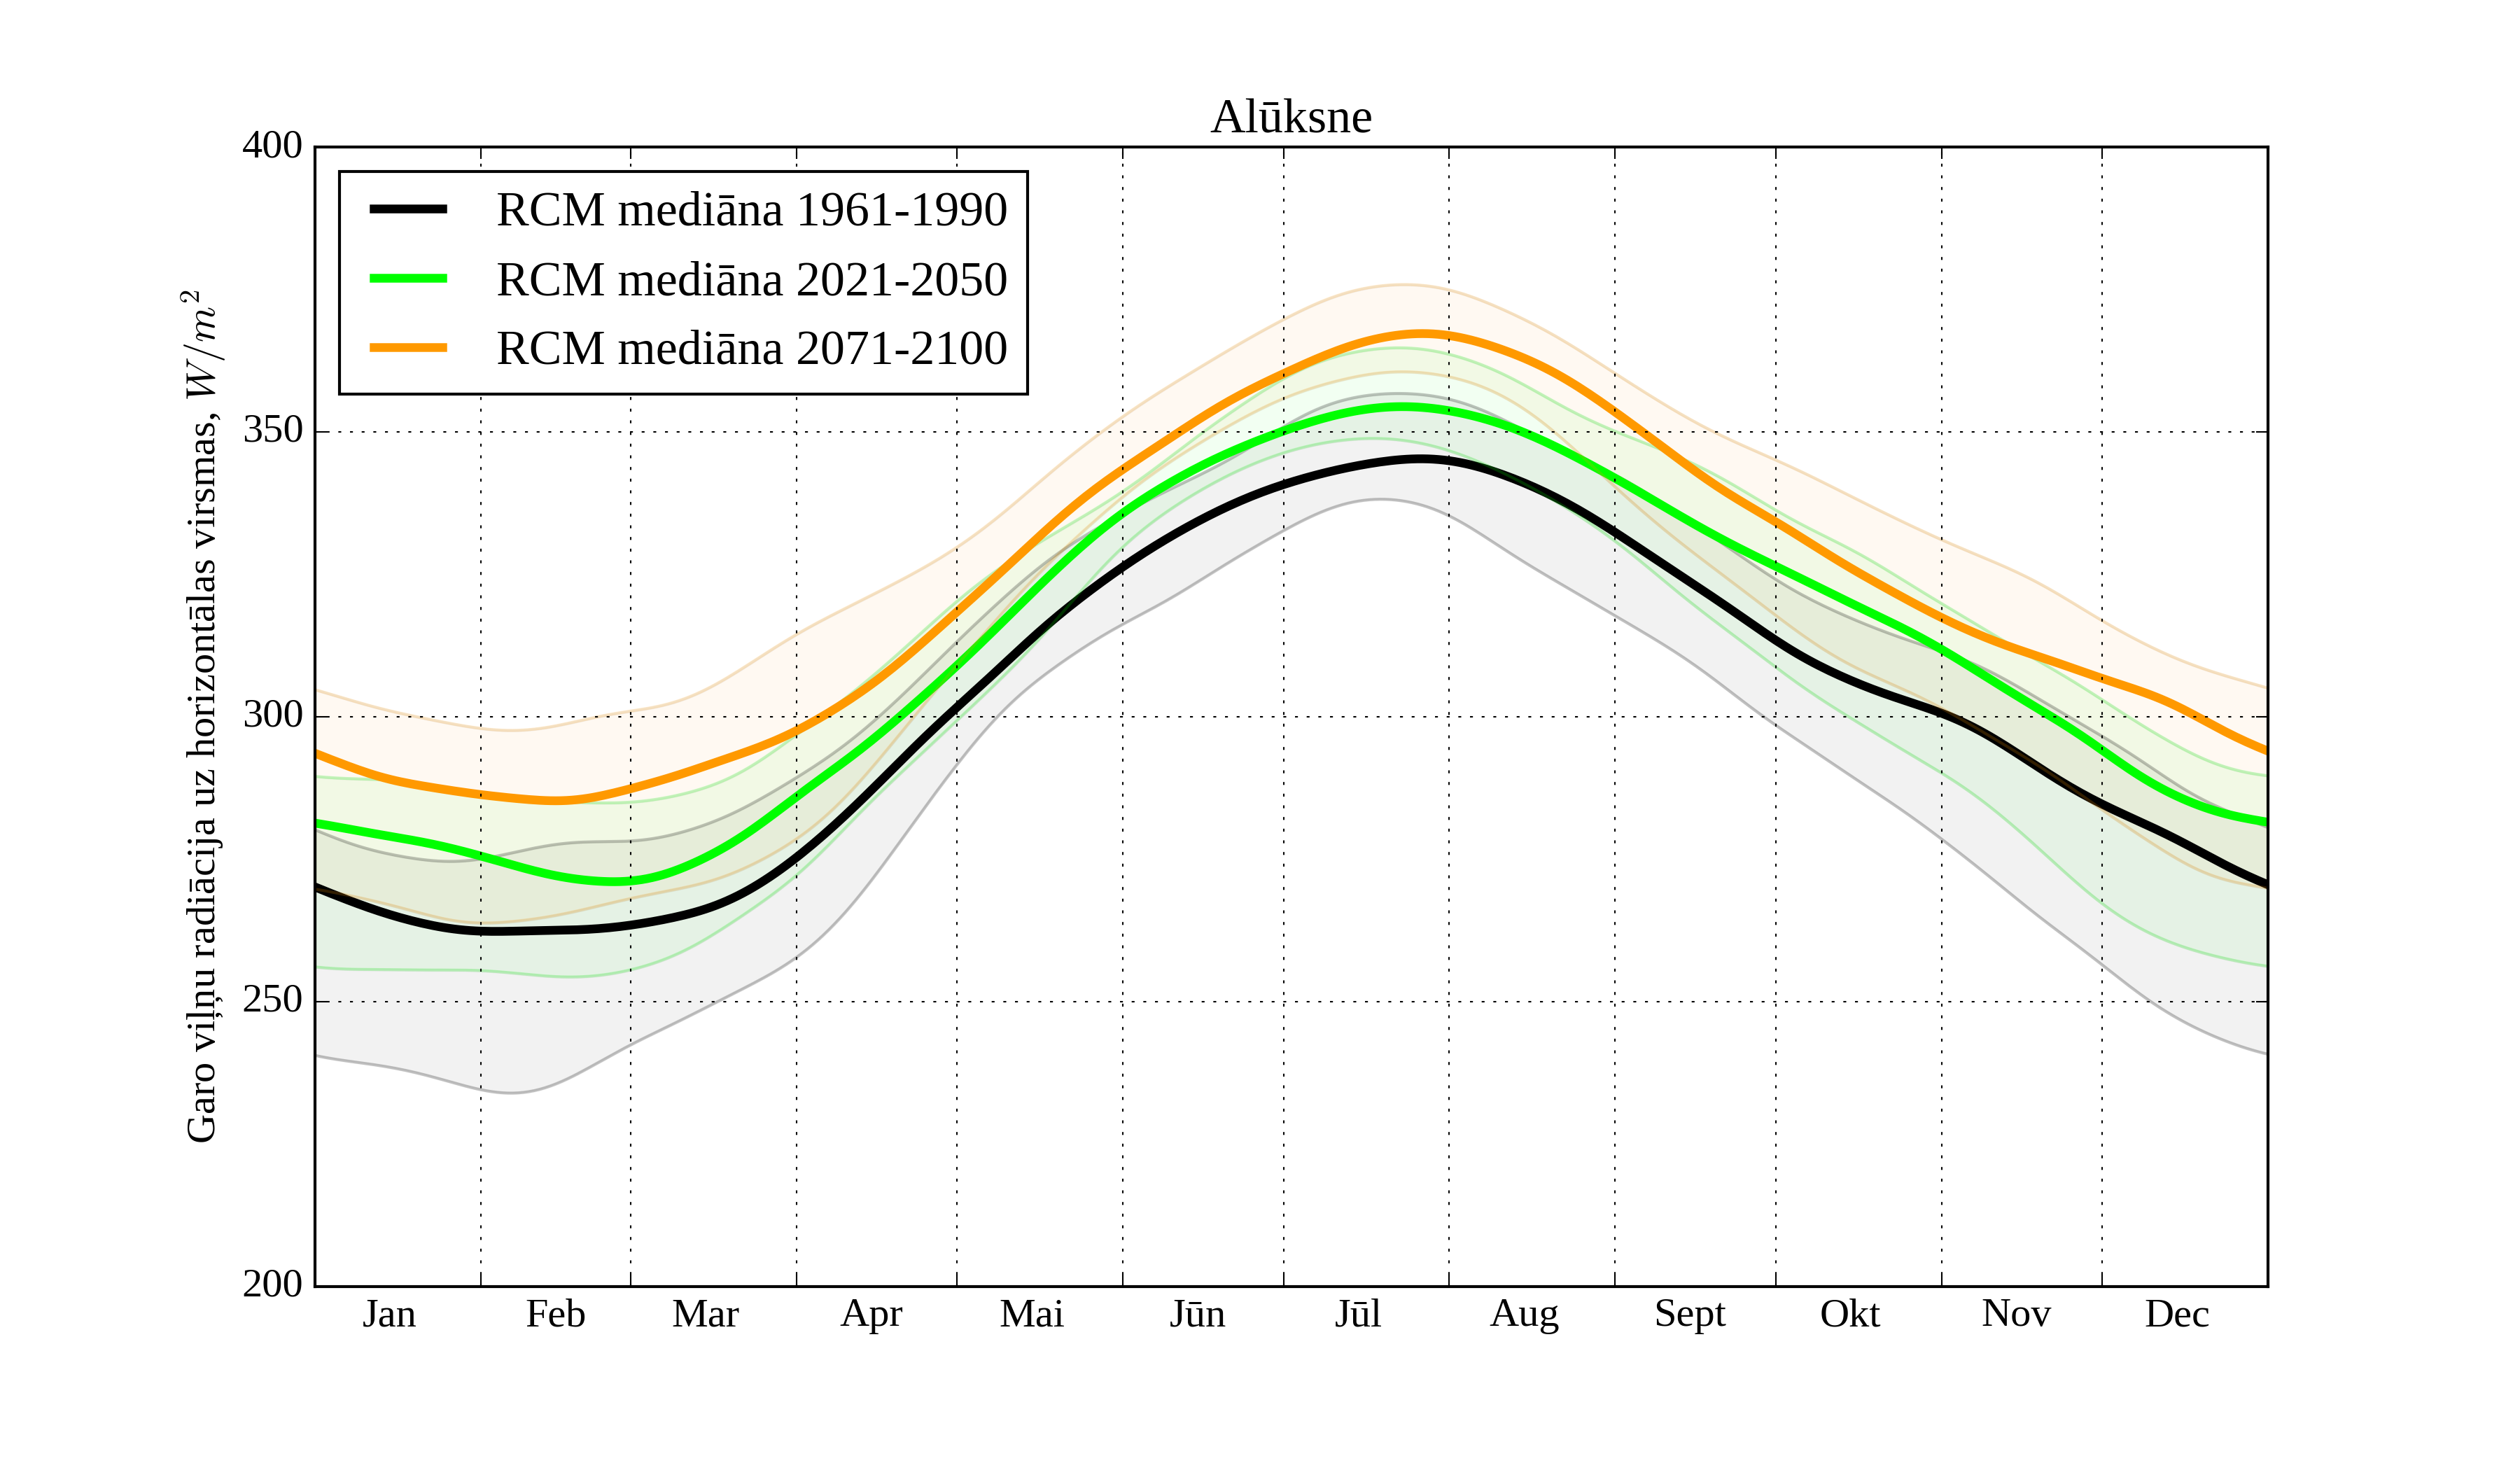
Now consider the climatological trend in montly distribution of long wave radiation, see Figures 35-38.
Figure 35. Monthly LW radiation on horizontal surface for different climatological periods in Kolka
Figure 36. Monthly LW radiation on horizontal surface for different climatological periods in Aluksne
Figure 37. Monthly LW radiation on horizontal surface for different climatological periods in Dobele
Figure 38. Monthly LW radiation on horizontal surface for different climatological periods in Daugavpils
As can be seen, there is positive trend in LW radiation for all monthes and stations.
Difference between climatological periods is relatively high.
Slight south-north gradient can be seen in yearly average values, see Figures 39-42.
Figure 39. Average annual LW radiation [W/m^2] on horizontal surface in period 1961-1990
Figure 40. Average annual LW radiation [W/m^2] on horizontal surface in period 2071-2100
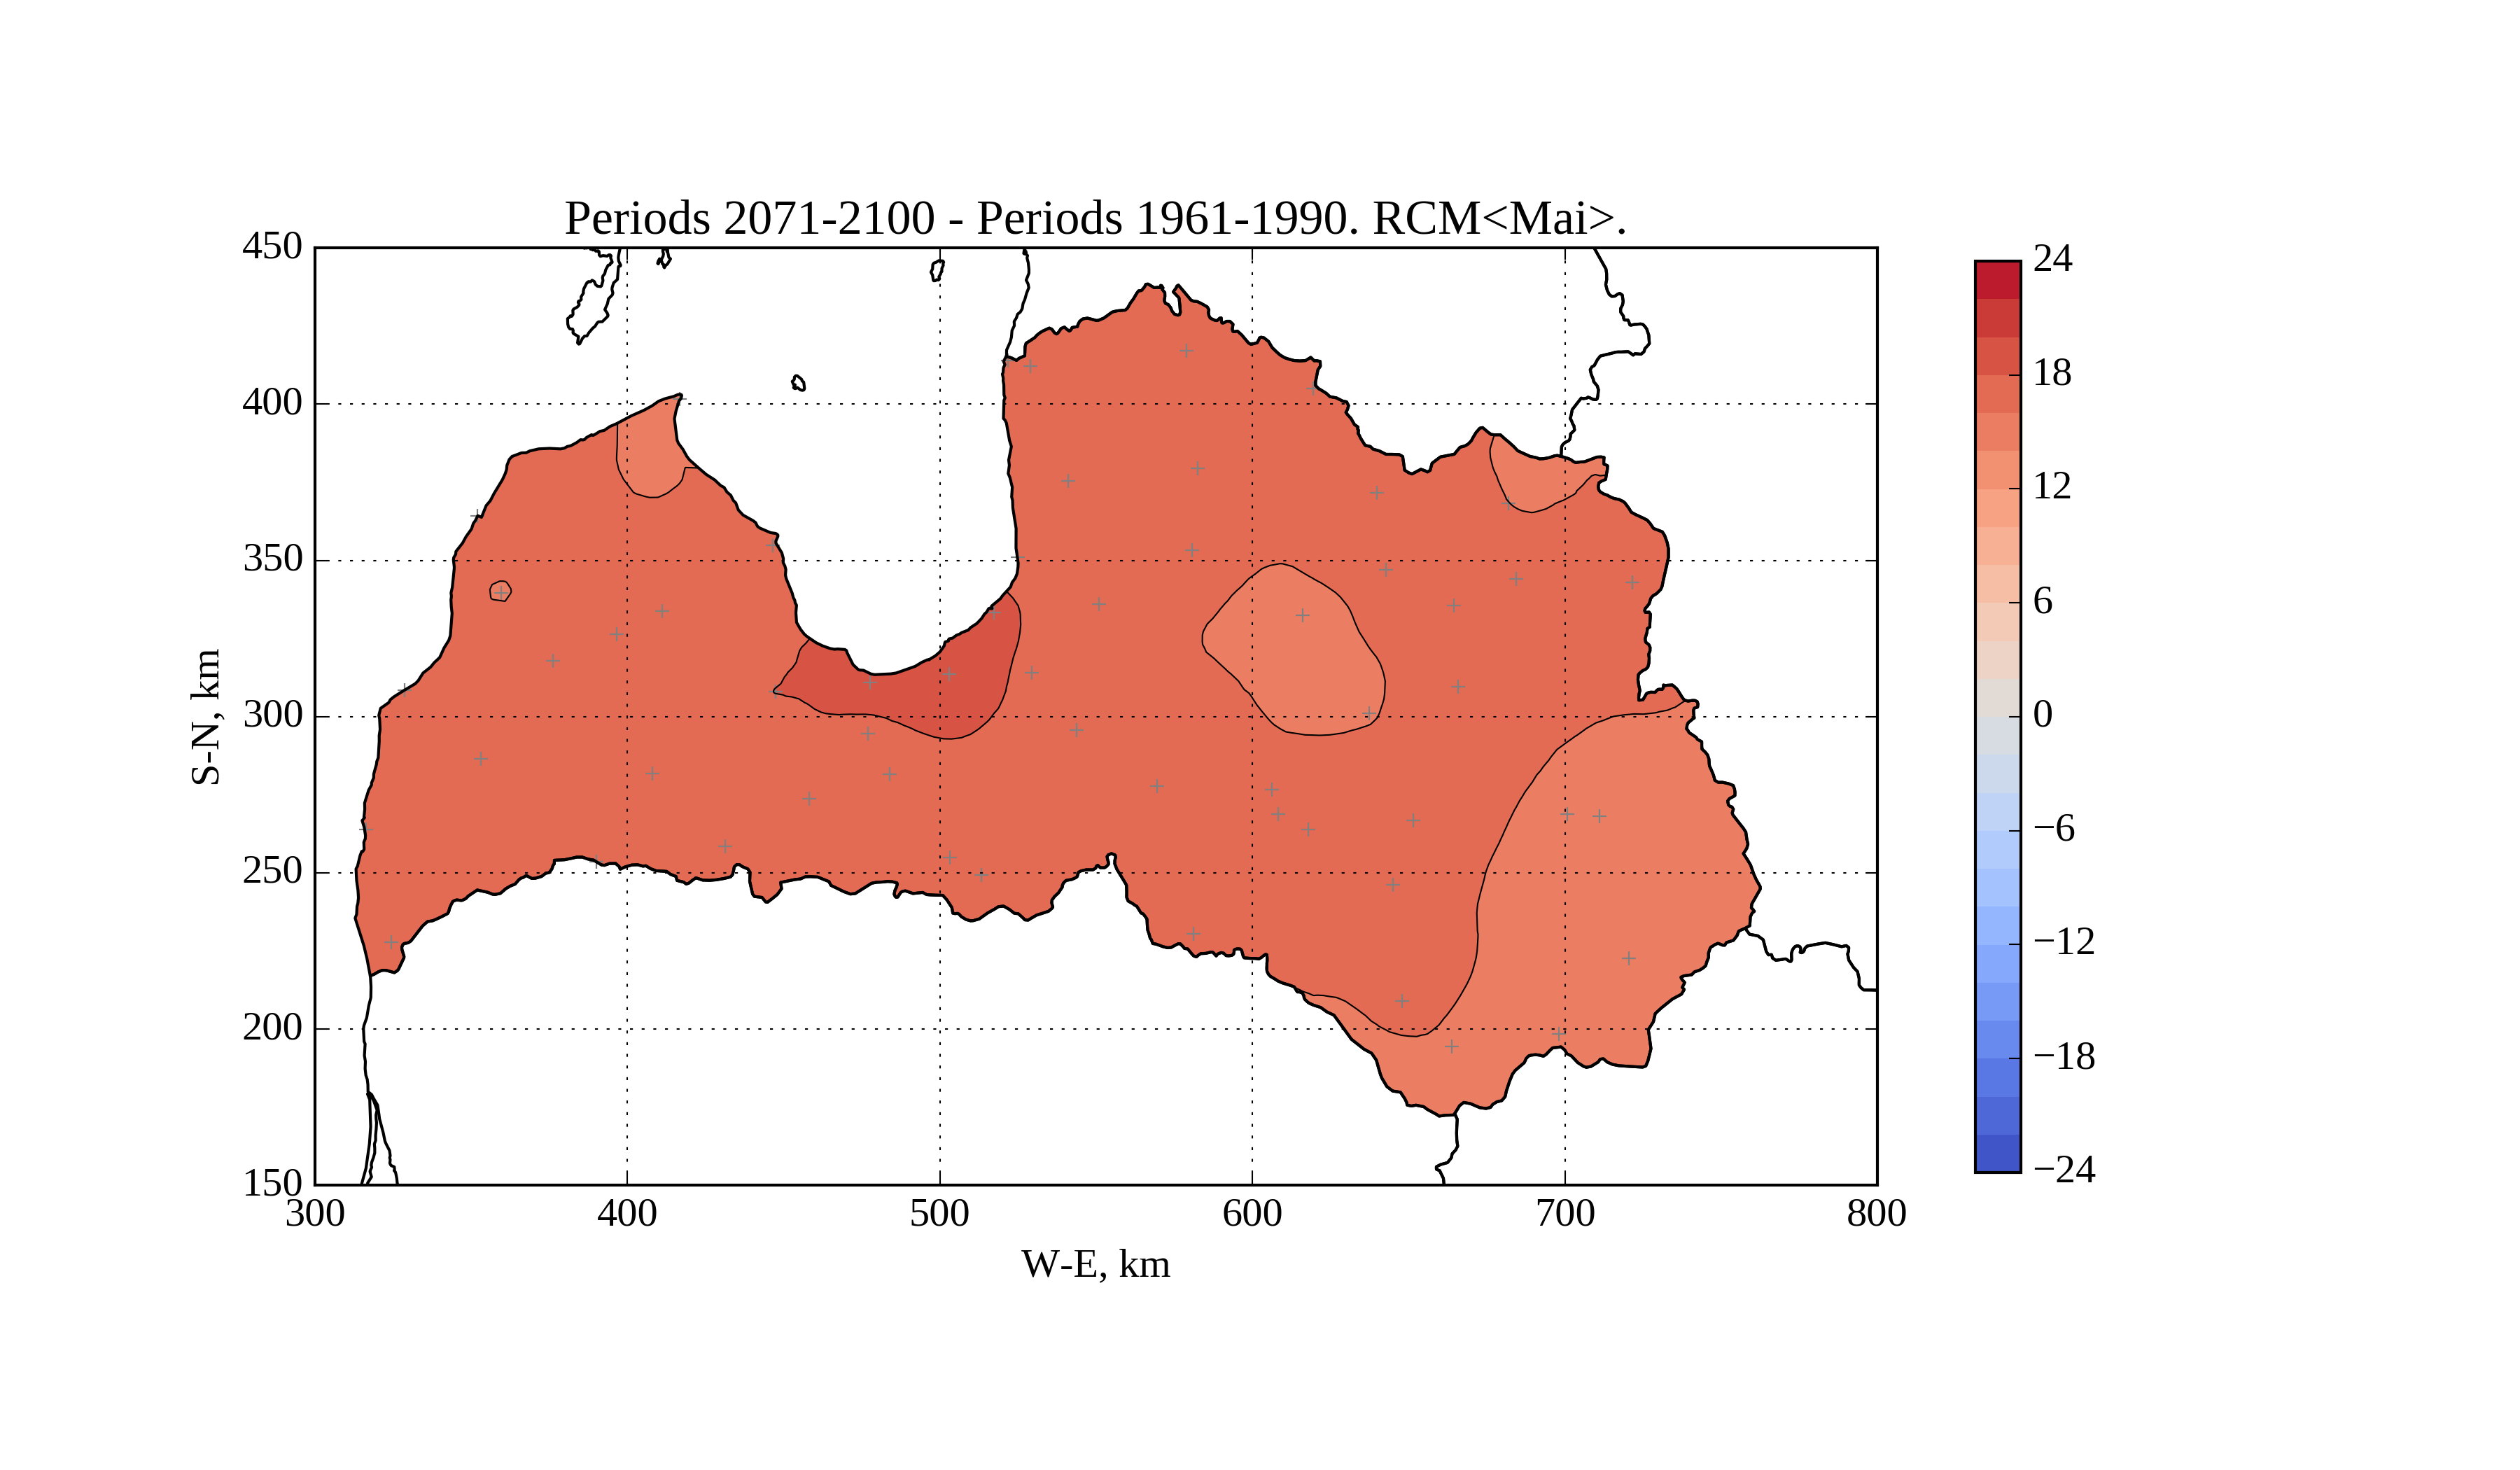
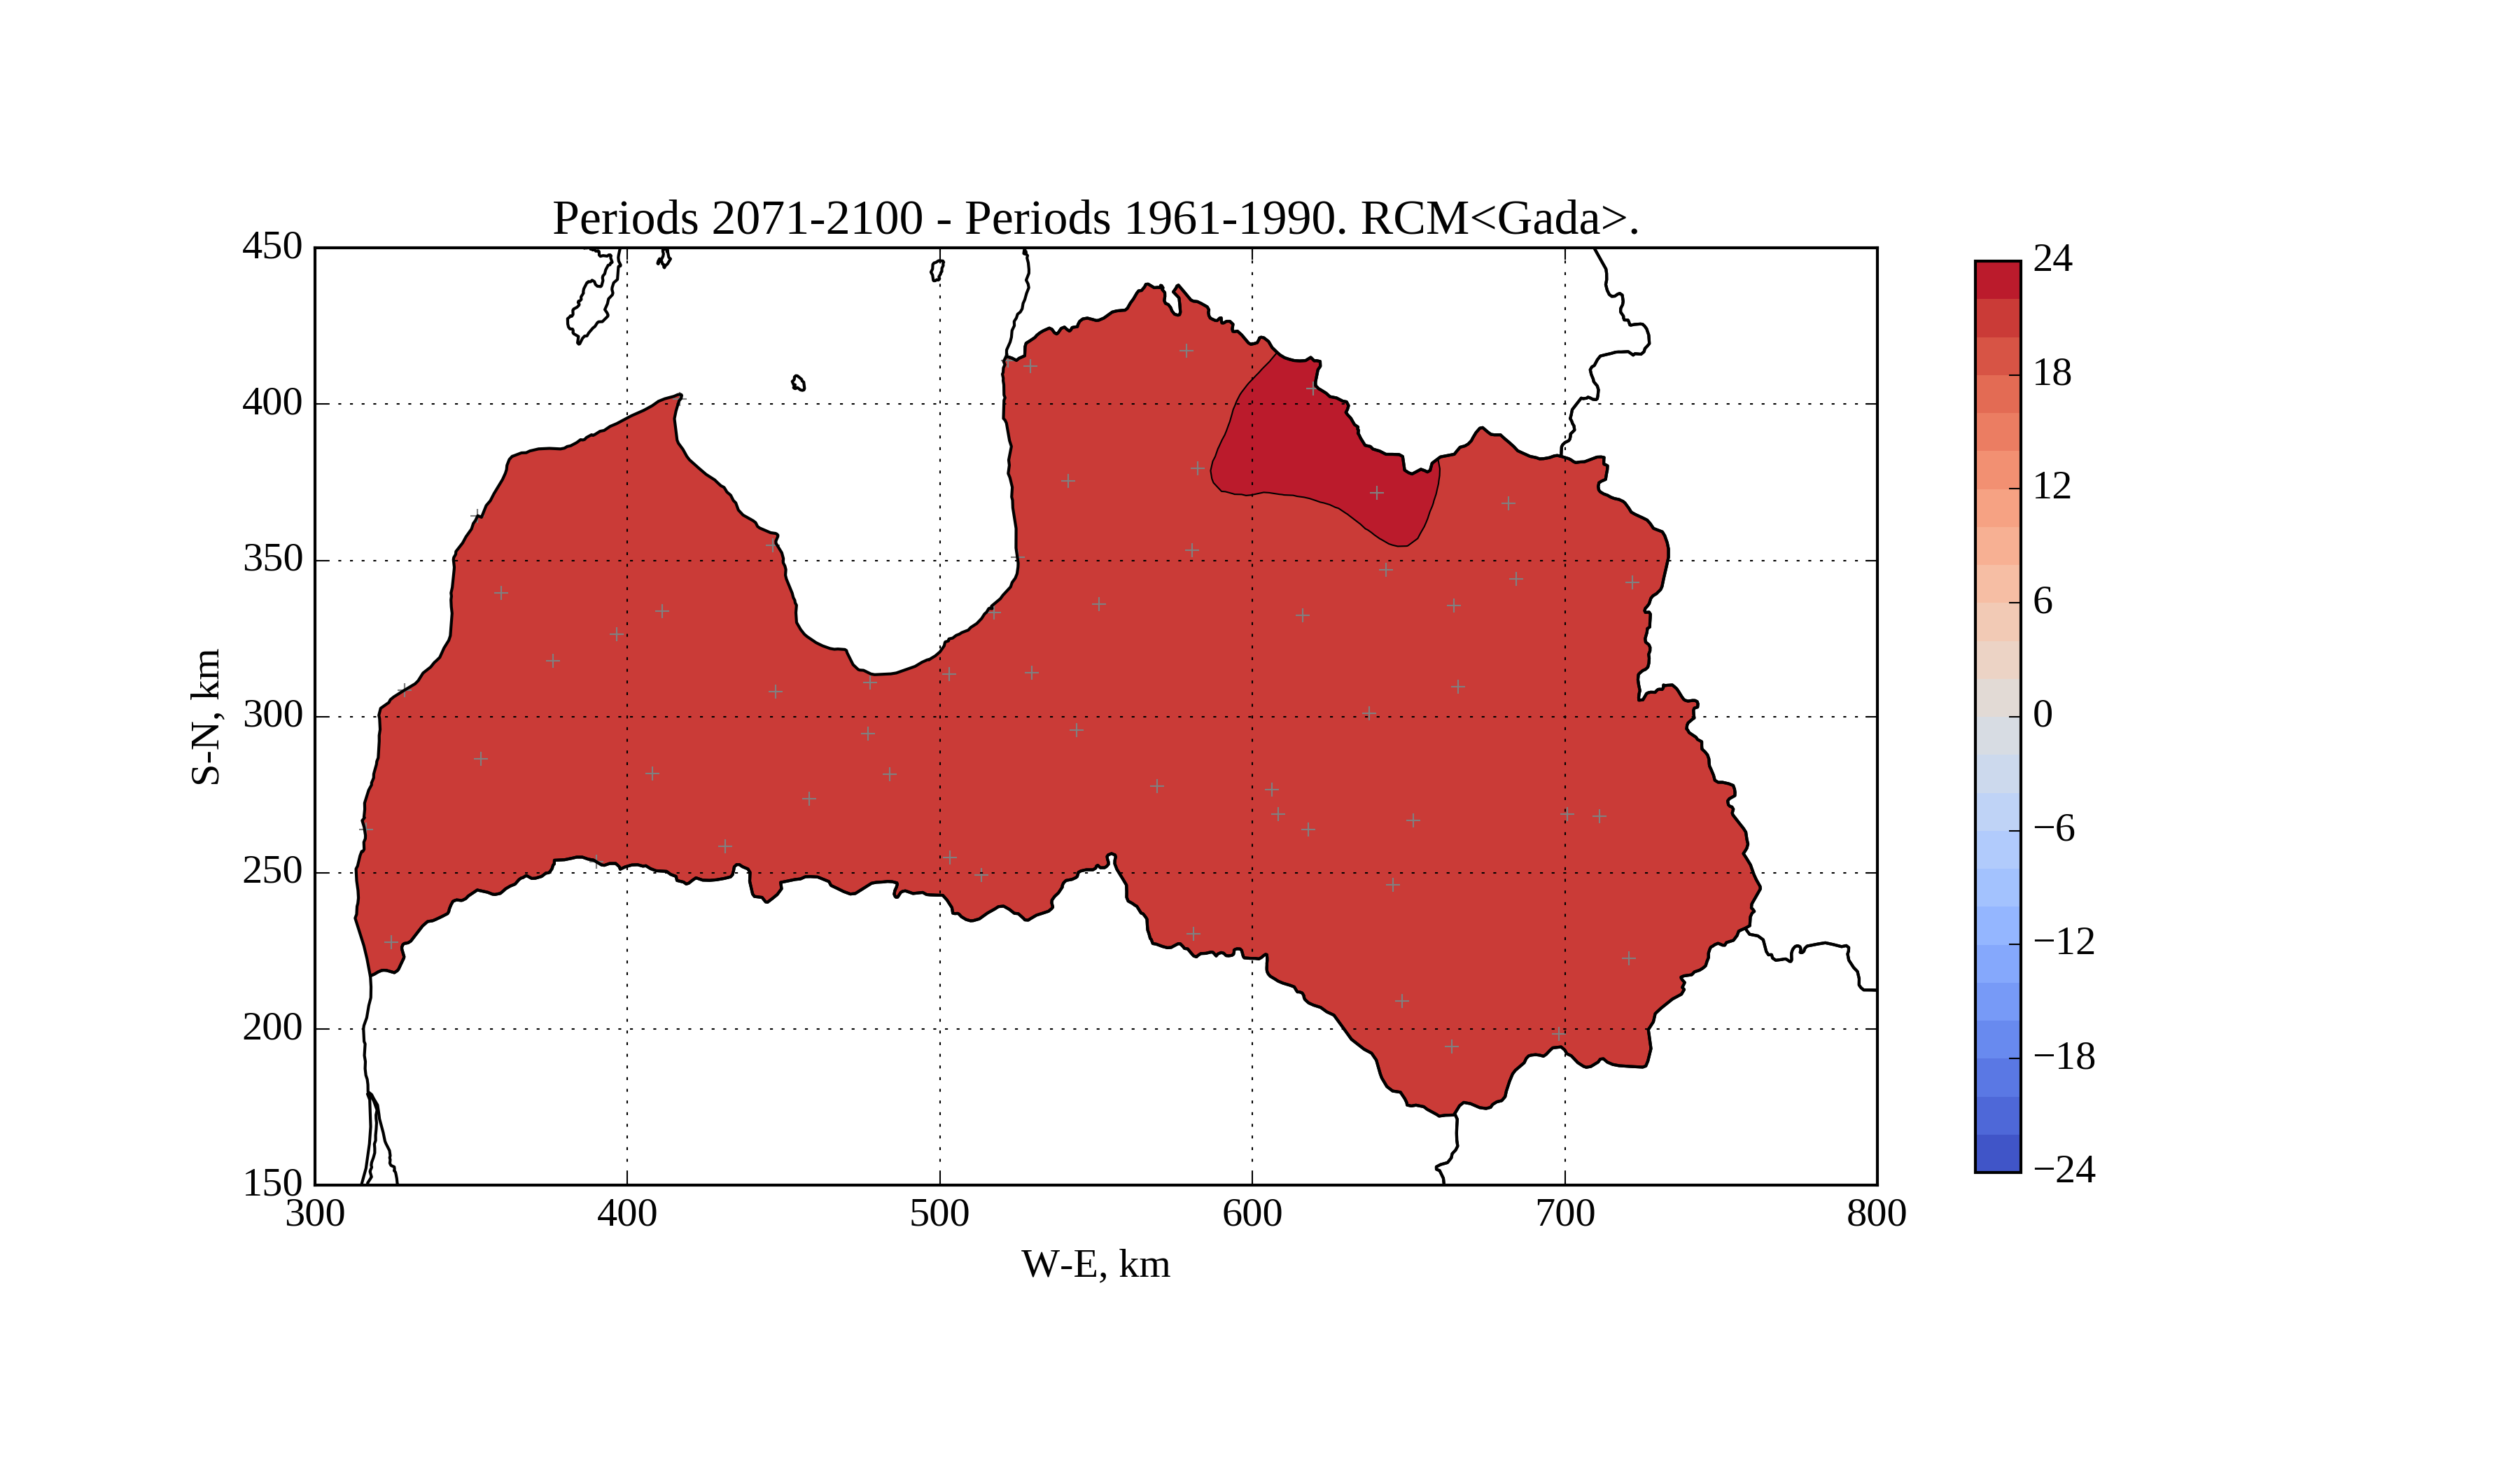
Figure 41. Change of average LW radiation [W/m^2] on horizontal surface in May from period 1961-1990 to 2071-2100
Figure 42. Change of yearly average LW radiation [W/m^2] on horizontal surface from period 1961-1990 to 2071-2100
The highest annual increase of long wave radiation will occur in northern Vidzeme, reesulting in larger homogenity of long wave radiation in teritory of Latvia.
Aaron Donohoe, Kyle C. Armour, Angeline G. Pendergrass, David S. Battistic.
Shortwave and longwave radiative contributions to global warming under increasing CO2.
Proc Natl Acad Sci U S A. 2014 Nov 25; 111(47): 16700–16705.
M. Maroof Khan, M. Jamil Ahmad. Estimation of global solar radiation using clear sky radiation in Yemen.
Journal of Engineering Science and Technology Review, 5(2), (2012), 12-19